

But bro what do you mean by an outlier? Let's take some examples of real life outliers. When we talk about Virat Kohli or Sachin Tendulkar , we talk about their greatness and the legacy they created in the world of cricket. Talk about Apple, Amazon ,Nvidia or Walmart. these are outliers in business field. Keeping it simple, outliers are datapoints which are out of average range of the domain(quantitively). Outliers can be negative or positive.
Let's understand how to perform outliers study in Data Science domain. When we deal with real raw data, it will be very messy and unfiltered. It will contain a lot of noise, features and datapoints from various sources.
Some ways we can detect outlier in the data: 1. ZScore calculation 2. IQR(inter quartile range) 3. Boxplot in case of continuous features.
Let's take them one by one with example: 1. Z-Score Calculation: It is statistical measure that describes how far a data point is from the mean of a dataset, in terms of standard deviations.
It follows 68–95–99.7 Rule. In first SD(standard deviation) , covers 68% of datapoints , 2nd SD covers about 95% of data and by reaching 3rd SD we cover 99.7% of data. So statistical study claims that beyond 3rd SD all datapoints are outliers(both +ve SD and -ve SD).
Implementation:
#defining dataset with outliers
dataset=[11,10,12,14,12,12,15,14,13,15,102,12,14,17,19,10,13,12,14,12,108,12,11,14,13,15,10,14,13,15,10]
# finding Outliers using Z_score
outliers=[]
def detect_outlier(data):
    threshold=3 #as 99.7% of data comes under 3 sd regions
    mean=np.mean(data)
    std=np.std(data)
    for i in data:
        z_score=(i-mean)/std
        if np.abs(z_score) > threshold:
            outliers.append(i)
    return outliers
outliers_points=detect
print(outliers_points)
Output: [102, 108]
2. IQR : Interquartile Range (IQR) is a measure of statistical dispersion and represents the range within which the middle 50% of data lies in a dataset. we get data points at 25% 50%(mean) and 75% range. and upper tick(q3+1.5*iqr) and lower tick(q1-1.5*iqr) which determines the max and min values.
Implementation:
dataset=sorted(dataset) # works only with sorted dataset
q1,q3=np.percentile(dataset,[25,75])

# lower and higher fence
iqr=q3-q1
lower_fence=q1-(1.5*iqr)
higher_fence=q3+(1.5*iqr)

outliers_iqr=[]
def detect_outlier_iqr(data):
    for i in data:
        if i<lower_fence or i>higher_fence:
            outliers_iqr.append(i)
    return outliers_iqr

detect_outlier_iqr(dataset)
Output: [19, 102, 108]
3. Visualization of quartiles and Outliers using Seaborn library:
import seaborn as sns
sns.boxplot(dataset)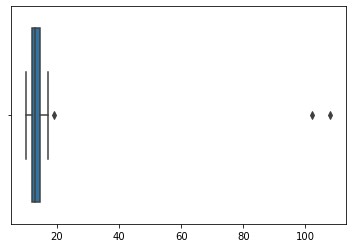
Good time to rest now. Today we completed outlier study which is very very important when we are dealing with real world data.
Thanks!!!