Pandas is a data science library that data scientists use on a daily basis. It helps us clean data, wrangle data, and even make visualizations.
I've been using Pandas for quite a long time and I realized that there are some methods I use on most data science projects. They're essential when it comes to working with dataframes, but using them over and over again gets a bit dull sometimes (and you might occasionally forget their syntax).
This is why, in this article, I'll show you how to simplify the 6 most common Pandas methods using a library called Mito. Instead of using Python code, Mito will allow us to interact with a Pandas dataframe as if it was an Excel workbook.
First Things First — Install Mito
To simplify the 6 common Pandas methods listed in this article, first, we need to install Mito, so open a new terminal or command prompt and run the following command (if possible, install it in a new virtual environment):
python -m pip install mitoinstaller
python -m mitoinstaller install
Keep in mind that you need Python 3.6 or above and JupyterLab for Mito to work properly.
After this, restart the JupyterLab kernel, and refresh the browser page to start working with Mito. For more information, you can check their Github and documentation.
1. read_csv
Without a doubt, read_csv is the most common Pandas method ever. Reading a file to create a dataframe is the starting point of every data science project.
You can import a CSV file with a couple of clicks using Mito. You only need to import mitosheet and create a sheet.
import mitosheet
mitosheet.sheet()
After running the code above, a purple sheet will appear and you only need to click on the "Import" button to import any dataset from your working directory.
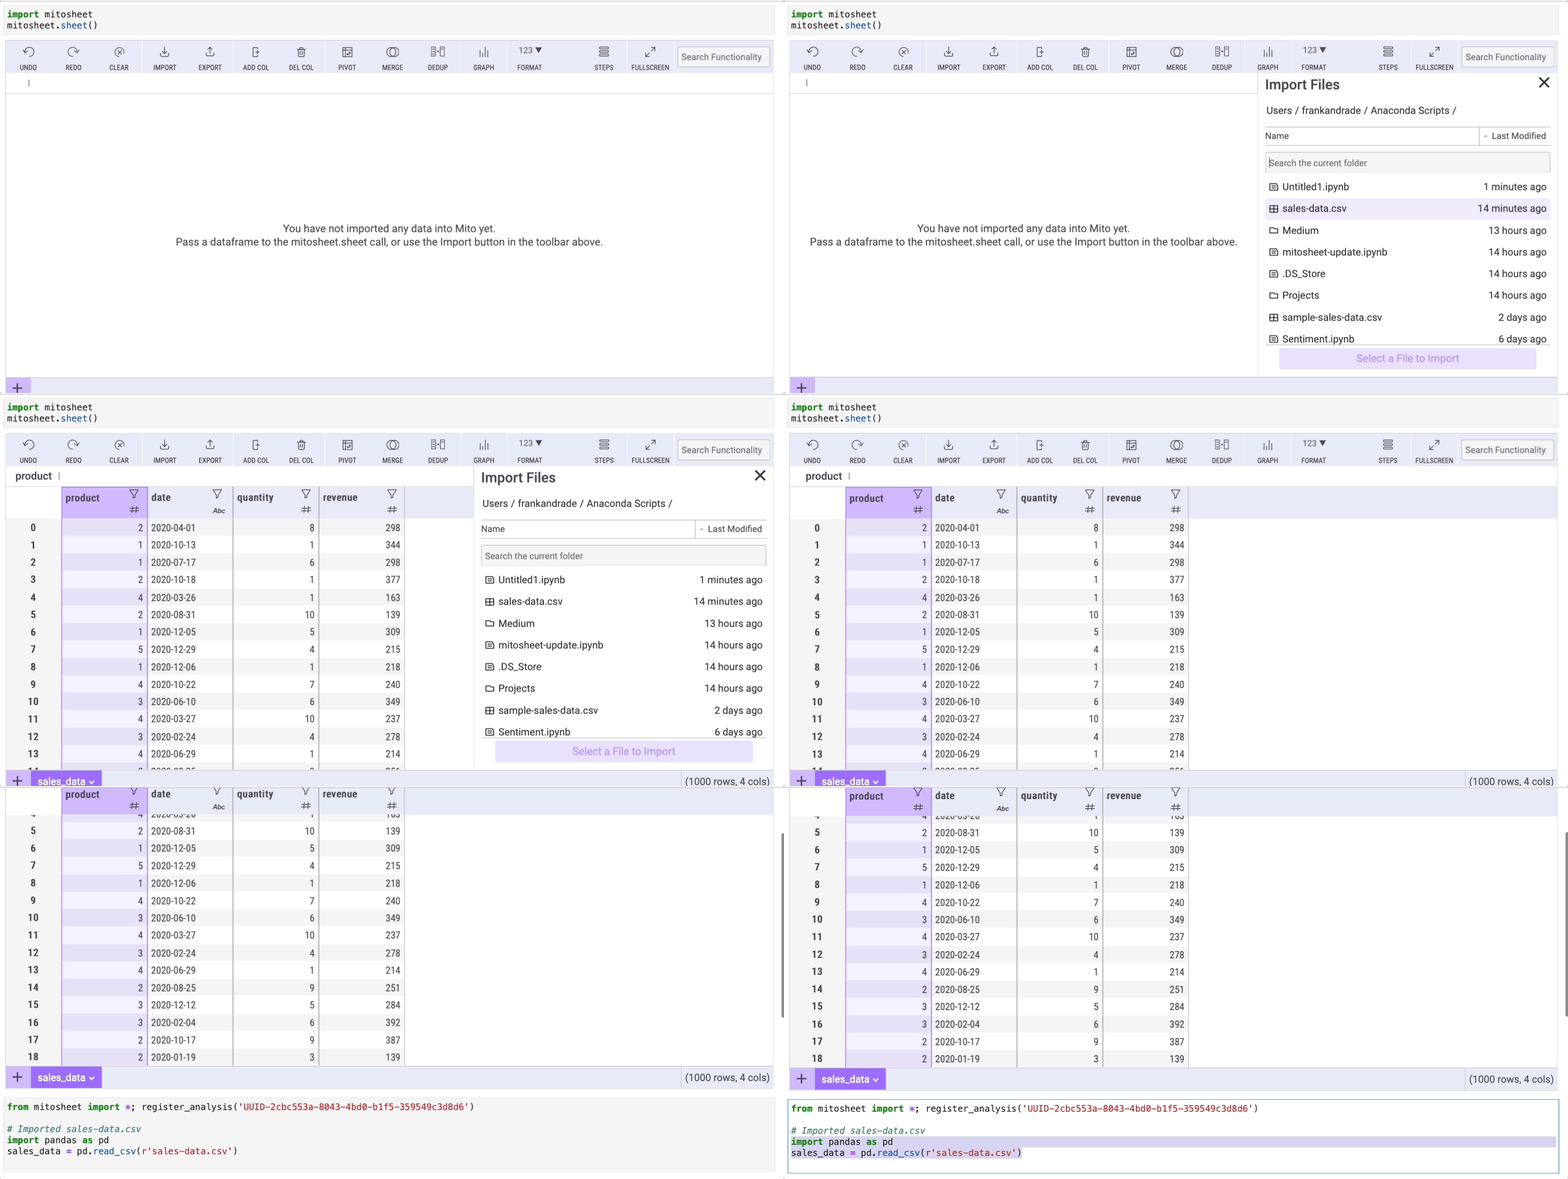
In this example, I imported a dataset named 'sales-data.csv' that I created myself for this example and you can find it on my Google Drive.
Note that in the cell below Mito will generate the Python code that made this import possible.
2. value_counts
Another common Pandas method is value_counts. This method allows us to get counts of unique values within a column. You can get the same functionalityvalue_counts has with a couple of clicks using Mito.
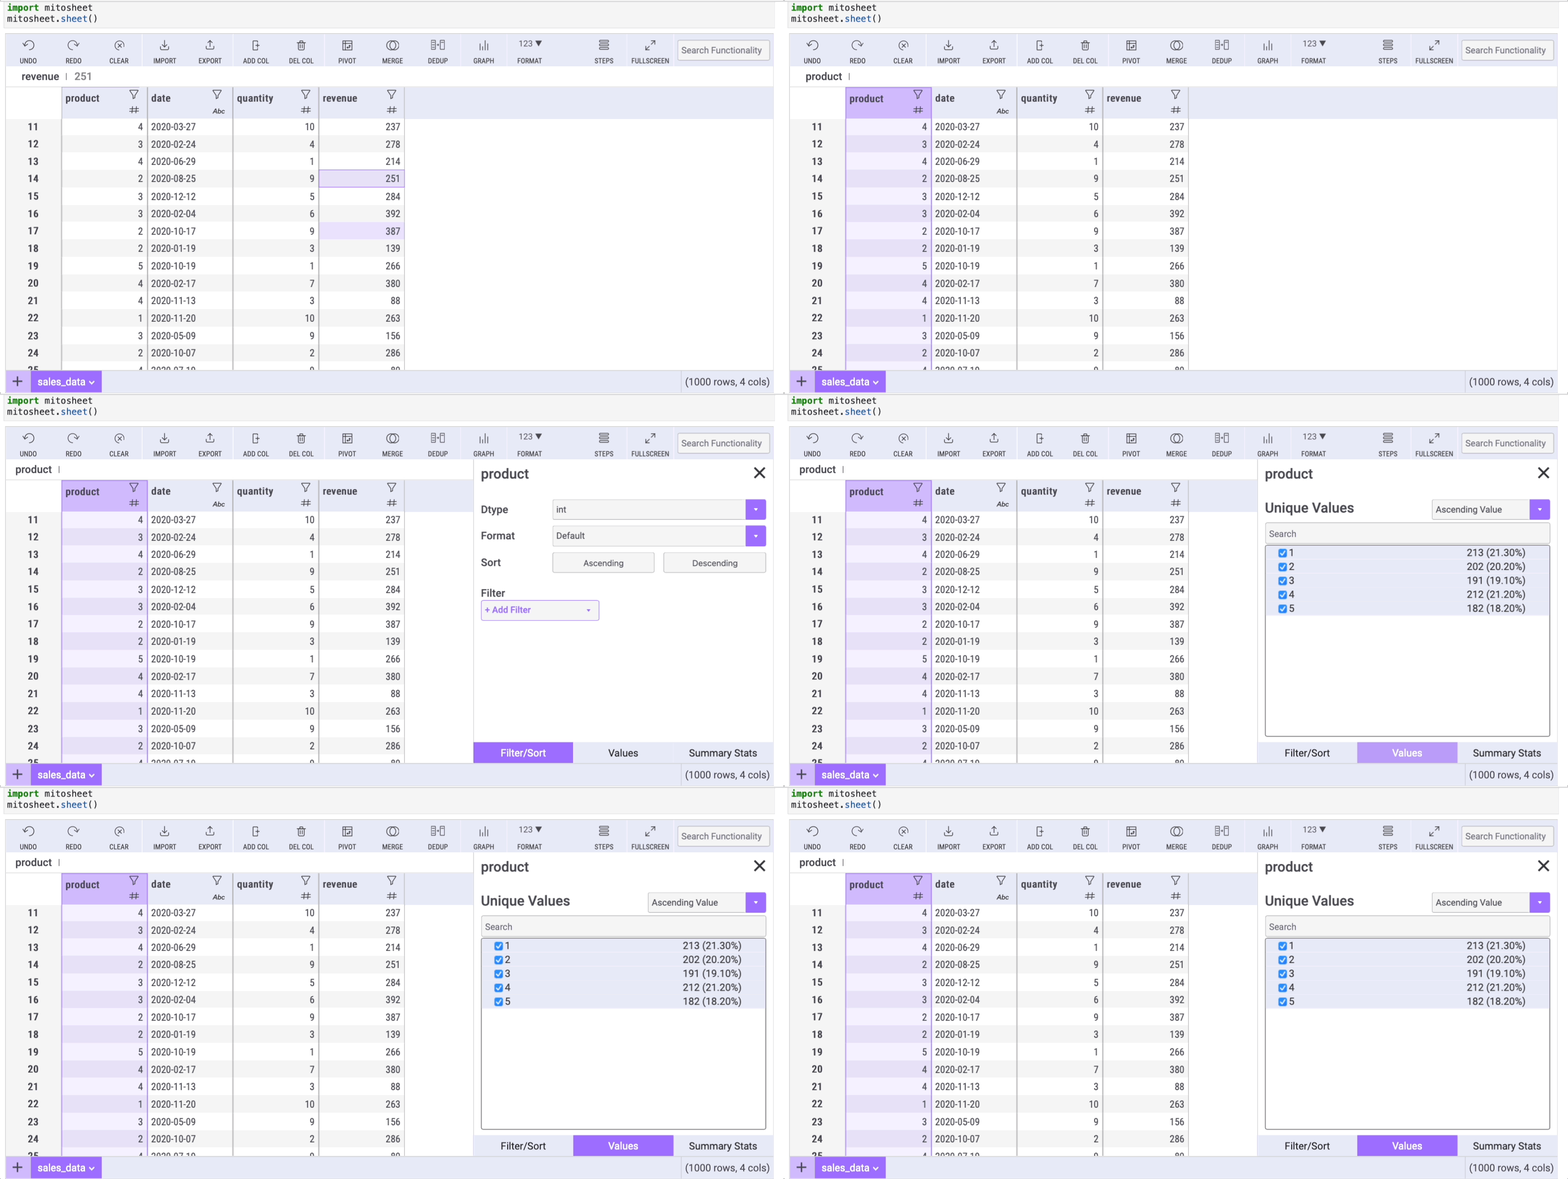
Let's count the unique elements within the "product" column. To do so, you only need to select the column and click on the filter button:

The window this button opens has 3 tabs. Each tab will help us replace some common Pandas methods listed in this article, so remember it!
Select the "Values" tab to get the get counts (and percentages) of unique values with Mito.
3. astype
I can't tell how many times I had to change the data type of a column by using the astype method in Pandas.
Mito can help us change the data type with a couple of clicks too! Mito by default shows the data type of all the columns using icons beside the column name.
Let's say we want to set the data type of the "date" column to date (it's currently set to string). Changing the data type with Mito is as simple as clicking on the filter icon, selecting the "Filter/Sort" tab, and choosing any data type from the "Dtype" dropdown.
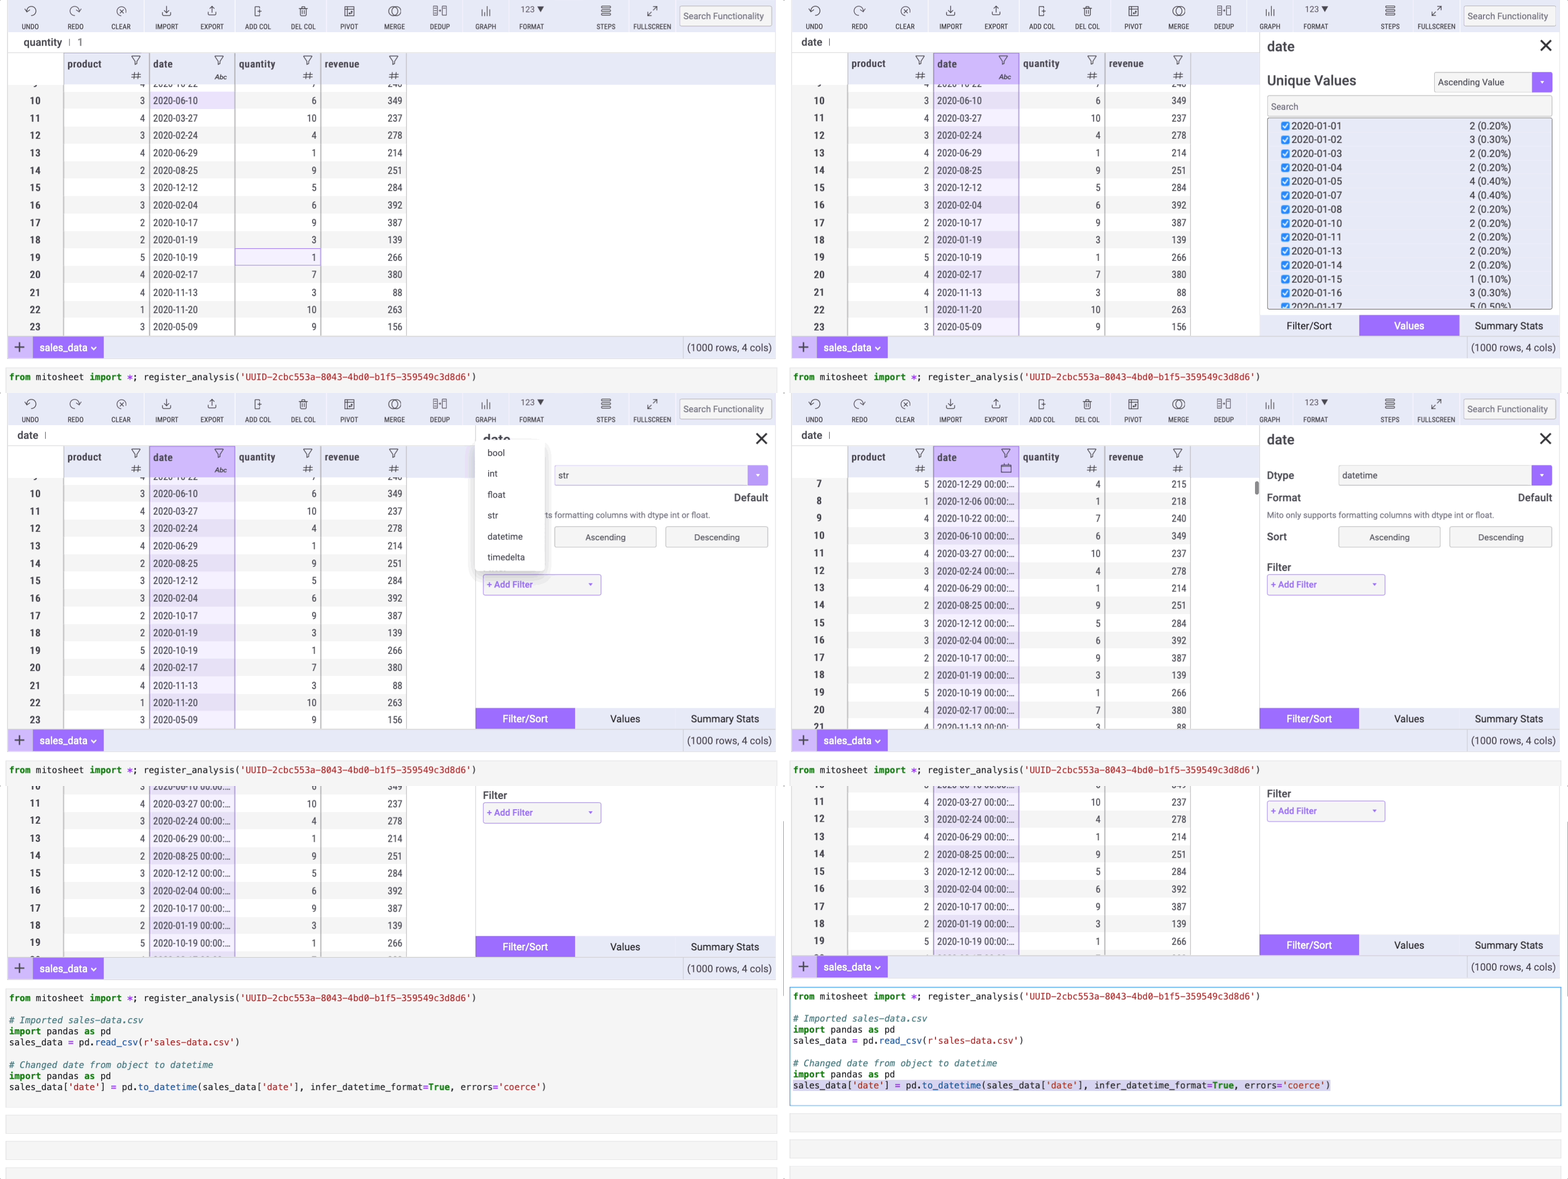
Again, the cell below the mitosheet will show the code automatically generated by Mito.
4. describe
This is a method we use in every data analysis. The describe method helps us get basic statistics from our data such as the mean, median, and mode.
Doing this with Mito is straightforward. We only need to click on the filter icon of any column and then select the "Summary stats" tab.
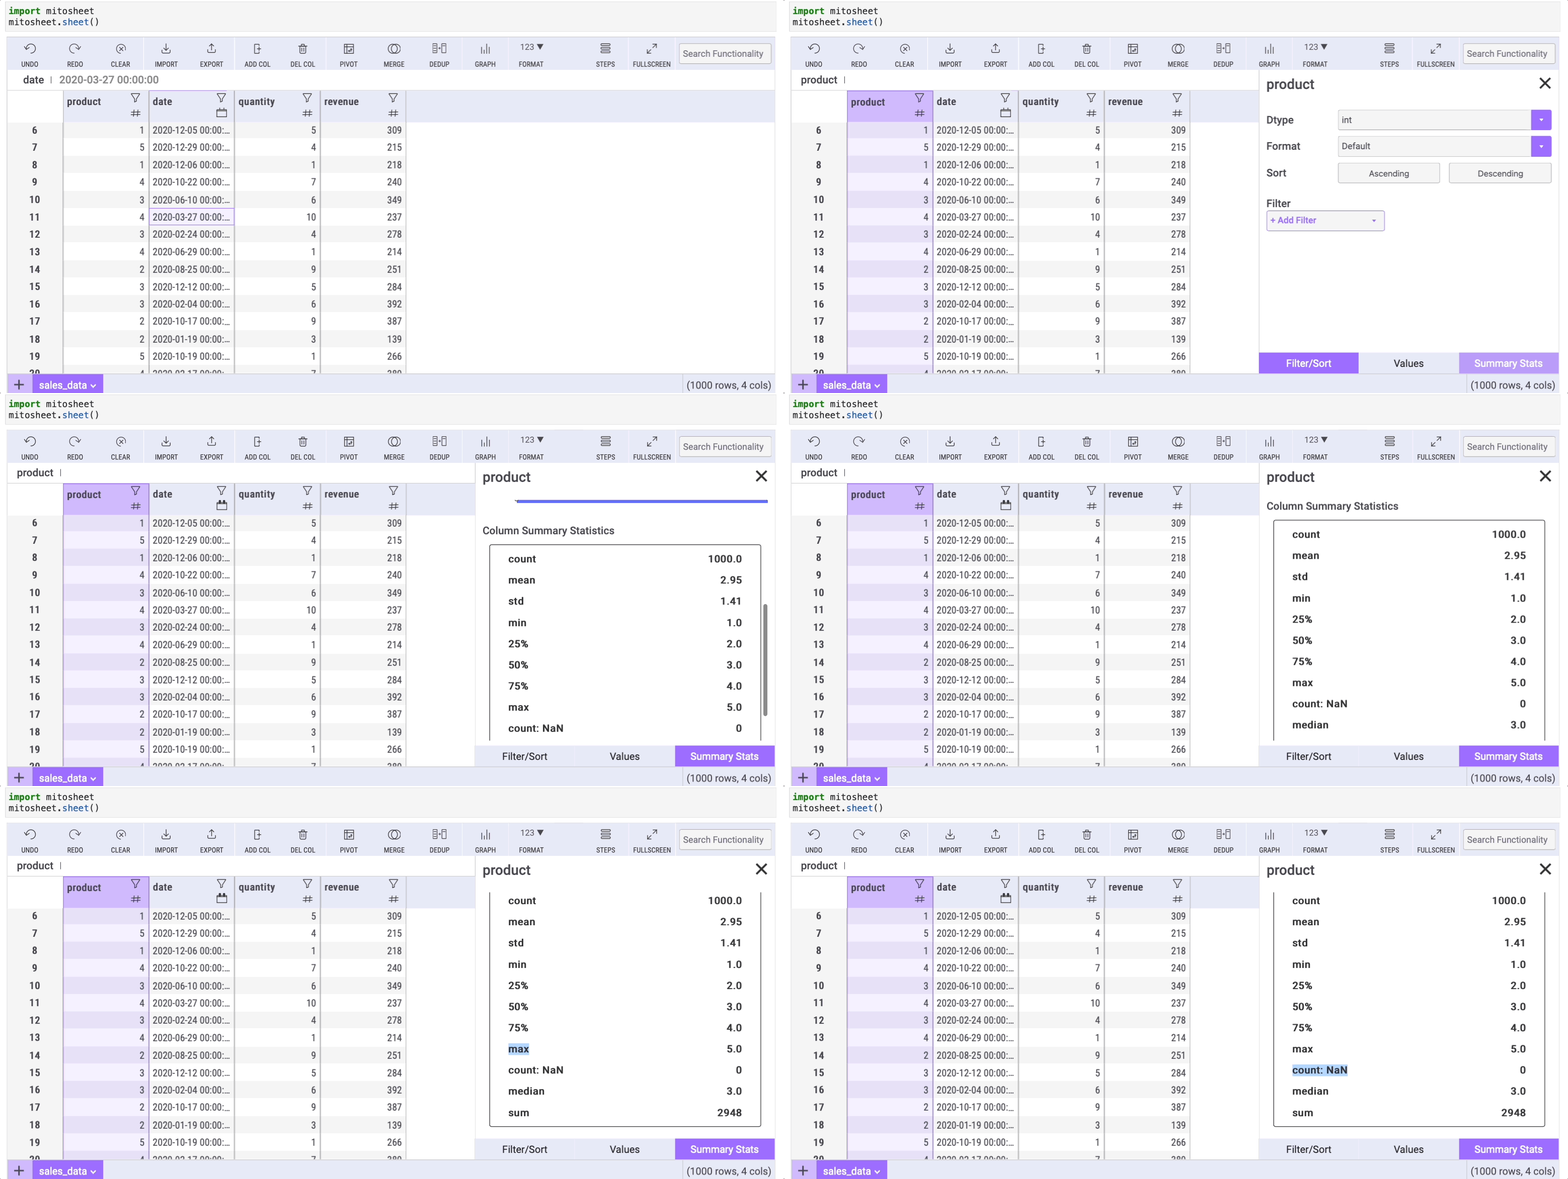
In addition to the typical info the describe method shows, the summary statistics in Mito has a "count: NaN" row that shows the number of missing data (NaN) within a column.
5. fillna
Real-world datasets most of the time have missing data. This is why, as a data scientist, you have to learn how to deal with missing data.
One way to deal with it is using the fillna method in Pandas. That said, this method can be simplified using a formula in our mitosheet.
First, we need to create a new column by clicking on the "Add Col" button. Then we go to any cell within the column we created and write the following formula:
=FILLNAN(series,'text-to-replace')where series is the column with missing data (for this example, I deleted some values from the "revenue" column to generate the missing data)
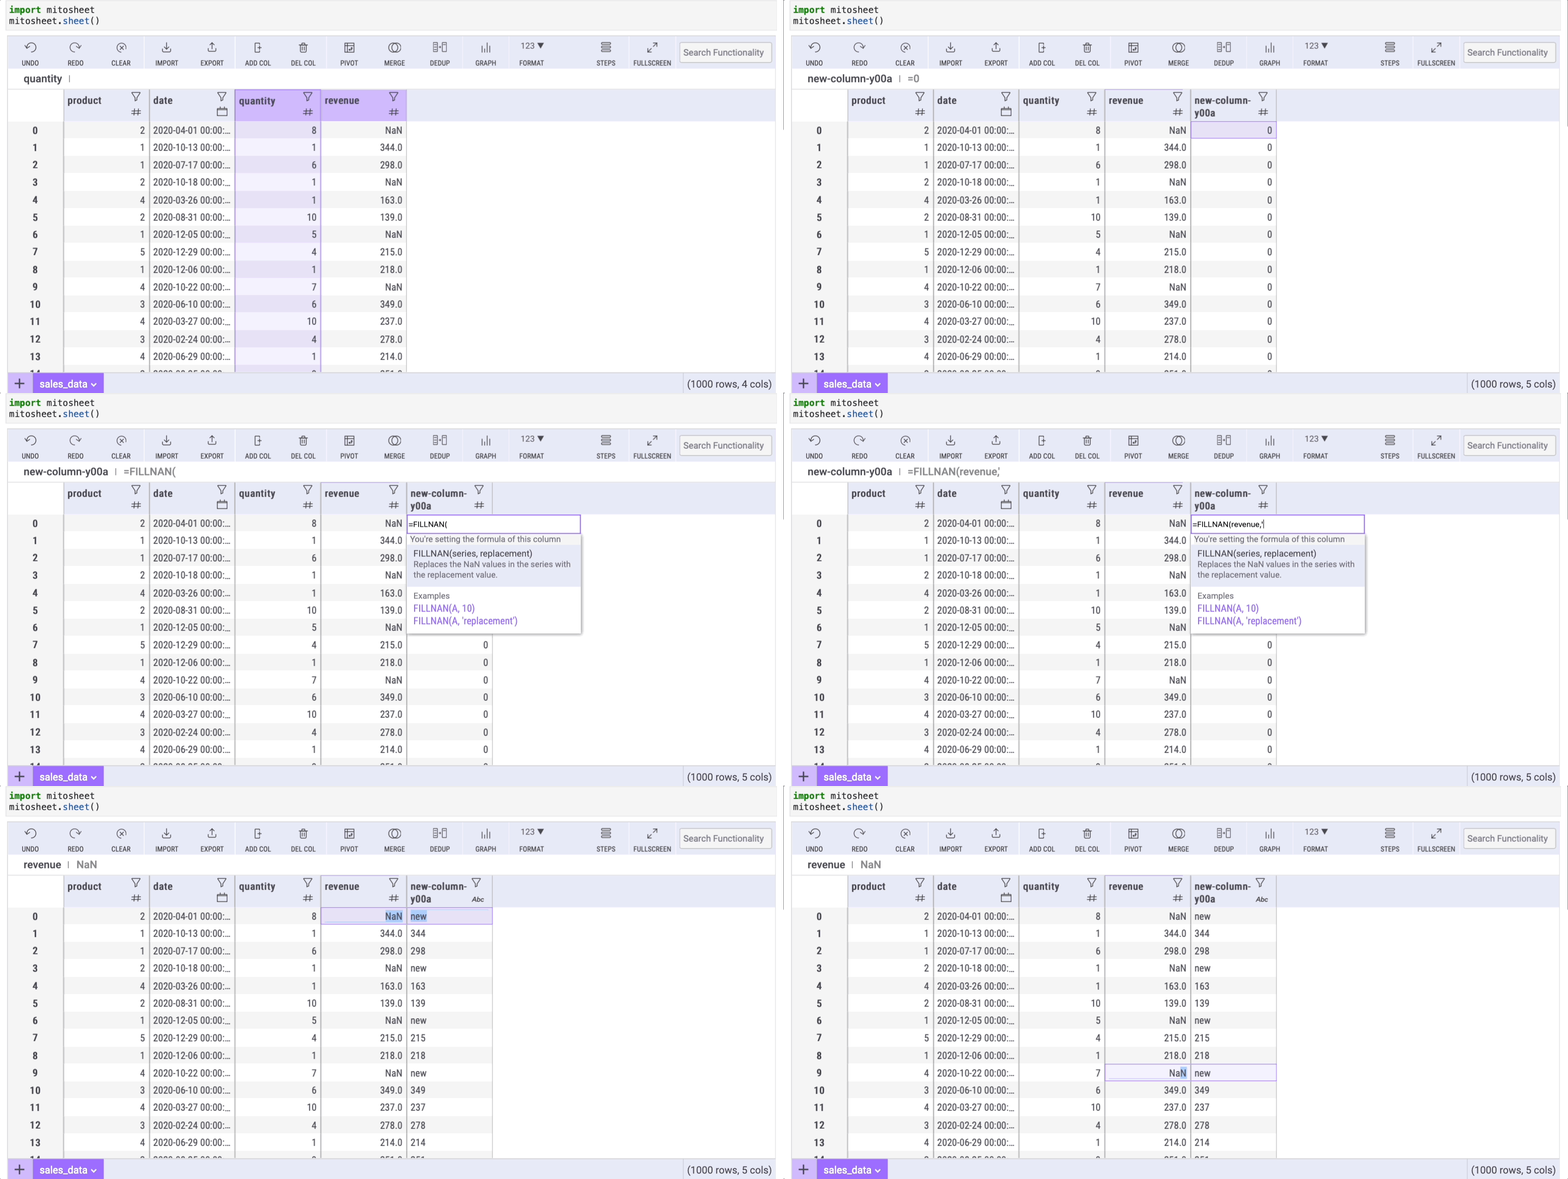
After pressing enter, all the cells will be auto-filled with the same formula. As a result, all the NaN cells from "column 1" will have the desired value in "column 2".
6. groupby
This is a method we use every time we want to aggregate data in order to count it, sum it, and more.
I couldn't find a native way to replace the groupby method with Mito, but there's a pretty good workaround to make this possible with a couple of clicks.
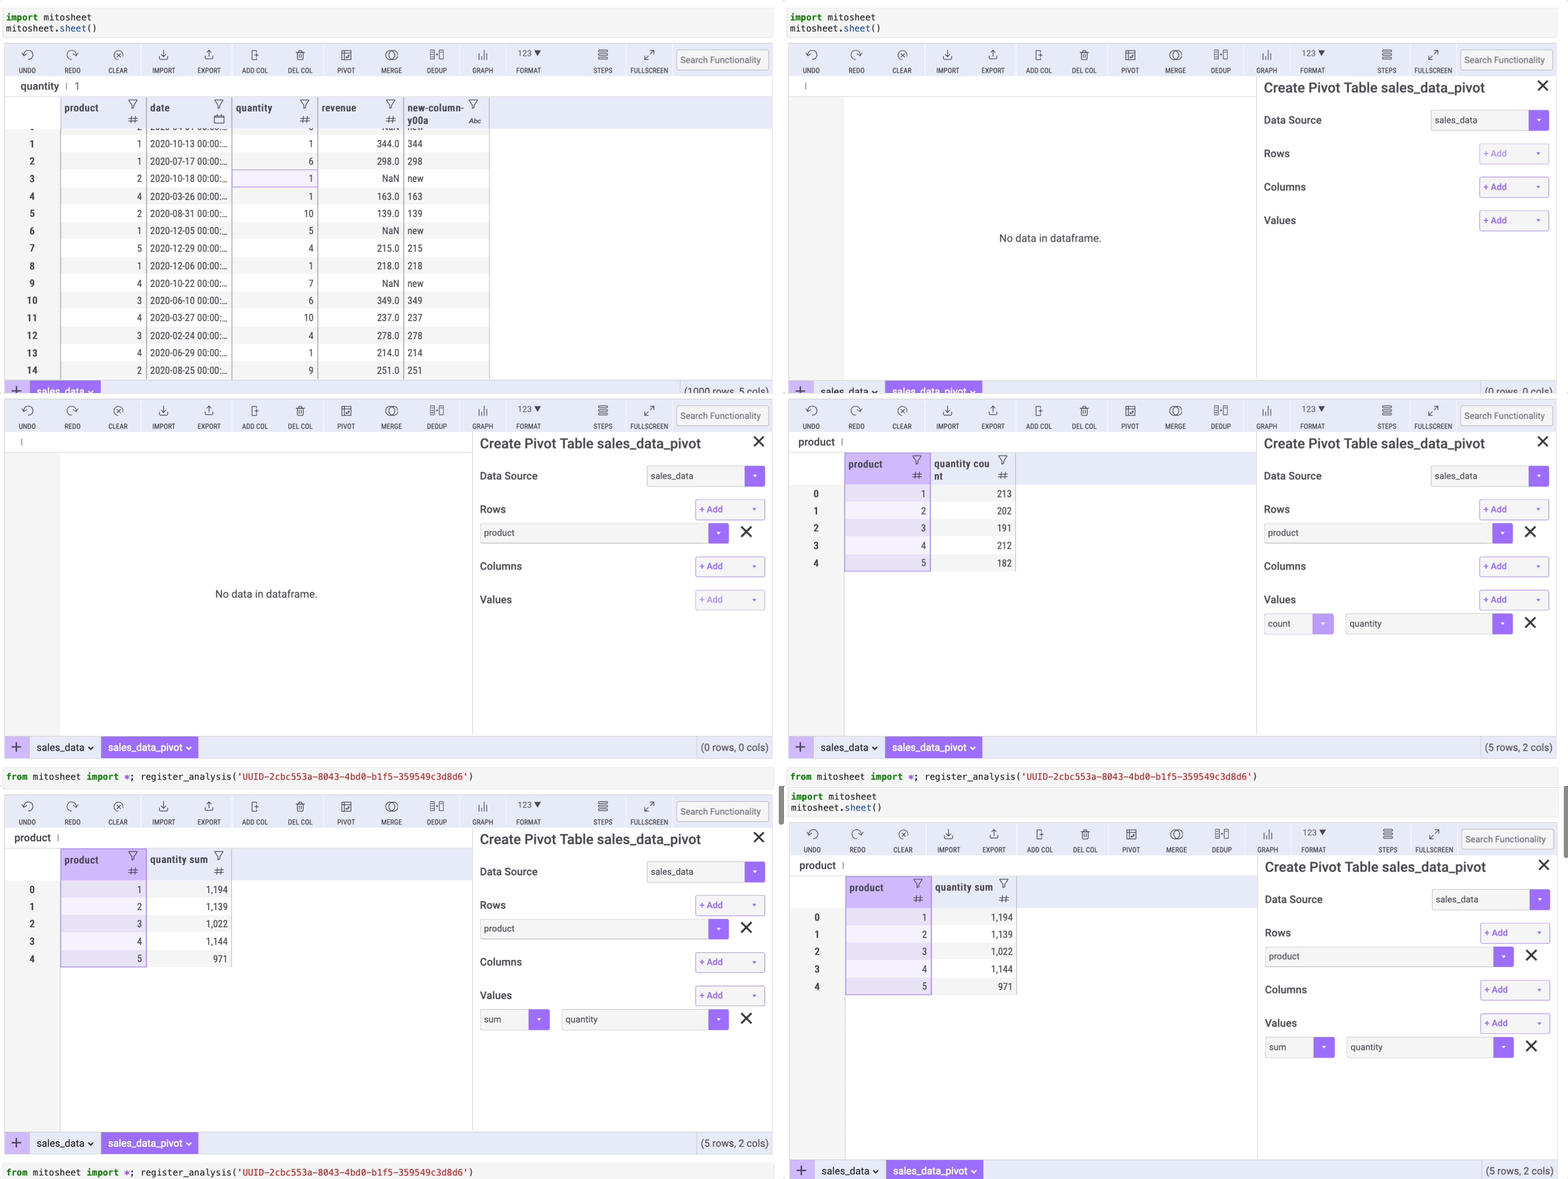
We only need to use the "Pivot" option in Mito. Then we have to select the rows/column and the data we want to display.
Say we want to group our data by product and then sum the quantity within each group. To do so, follow the steps below:
If you enjoy reading stories like these and want to support me as a writer, consider signing up to become a Medium member. It's $5 a month, giving you unlimited access to thousands of Python guides and Data science articles. If you sign up using my link, I'll earn a small commission with no extra cost to you.

