
Prerequisites
In this tutorial, I use version 0.12.0 of Manim. I have no idea if it works with earlier or later versions. I assume you know the basic use of Manim. If you don't, take a look at the many tutorials for beginners available.
The full code is available in the last section.
Create axis
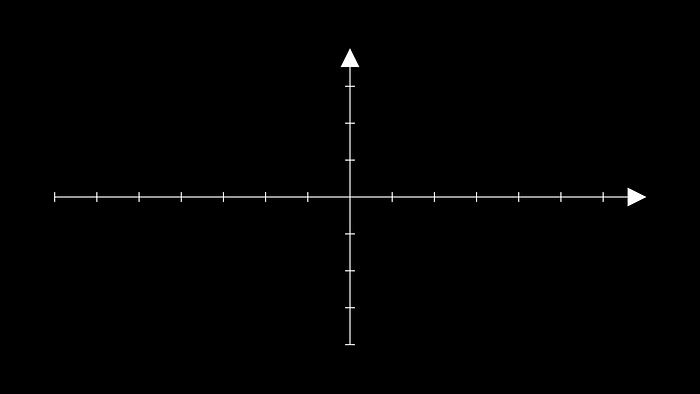
First thing to do is to create axis. For this, nothing could be simpler:
from manim import *  # I'll skip this line for the following

class MyBeautifulGraph(Scene):
    def construct(self):
        axes = Axes()
        self.add(axes)
Then, build the scene using
manim your_file.pyHere is the result.
Create a line

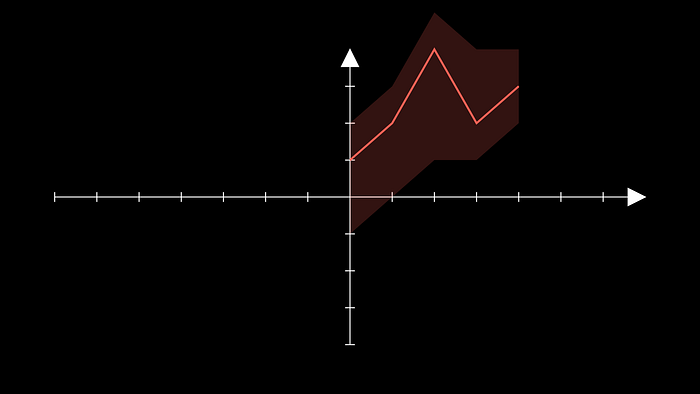
Very simple, no comments needed here.
class MyBeautifulGraph(Scene):
    def construct(self):
        axes = Axes()
        x = [0, 1, 2, 3, 4]
        y = [1, 2, 4, 2, 3]
        line = axes.plot_line_graph(x, y, add_vertex_dots=False)
        self.add(axes, line)
Create a shaded area

Here is the critical part. There is no function (to my knowledge) that allows you to create this shaded space with a line object. No problem! Here's the trick:
import numpy as np

class MyBeautifulGraph(Scene):
    def construct(self):
        axes = Axes()
        x = [0, 1, 2, 3, 4]
        y = [1, 2, 4, 2, 3]
        low_q = [-1, 0, 1, 1, 2]
        high_q = [2, 3, 5, 4, 4]
        line = axes.plot_line_graph(x, y, add_vertex_dots=False)
        # the following two lines won't be added to the scene!
        low_q_curve = axes.plot_line_graph(x, low_q)
        high_q_curve = axes.plot_line_graph(x, high_q)
        # get the points from the lines
        low_points = low_q_curve["line_graph"].points
        high_points = high_q_curve["line_graph"].points
        # and create a polygon, using those points
        points = np.concatenate((low_points, np.flip(high_points, 0)))
        area = Polygon(*points, fill_opacity=0.2)
        self.add(axes, line, area)
At this point, we have done the hardest part, the rest of this tutorial explains only some aesthetic adjustments to make the rendering more qualitative.
Color
Before we change the color, let's do some cleaning up. I'll pack everything into a dedicated function:
def build_plot(axes, x, y, low_q, high_q):
    line = axes.plot_line_graph(x, y, add_vertex_dots=False)
    low_q_curve = axes.plot_line_graph(x, low_q)
    high_q_curve = axes.plot_line_graph(x, high_q)
    low_points = low_q_curve["line_graph"].points
    high_points = high_q_curve["line_graph"].points
    points = np.concatenate((low_points, np.flip(high_points, 0)))
    area = Polygon(*points, fill_opacity=0.2)
    return VDict({"line": line, "area": area})

class MyBeautifulGraph(Scene):
    def construct(self):
        axes = Axes()
        x = [0, 1, 2, 3, 4]
        y = [1, 2, 4, 2, 3]
        low_q = [-1, 0, 1, 1, 2]
        high_q = [2, 3, 5, 4, 4]
        plot = build_plot(axes, x, y, low_q, high_q)
        self.add(axes, plot)
Perfect, now that it's clean, let's work only on that function. To change the color, let's add a color argument to our function.
def build_plot(axes, x, y, low_q, high_q, color):
    line = axes.plot_line_graph(
      x, y, add_vertex_dots=False, line_color=color)  # add color here
    low_q_curve = axes.plot_line_graph(x, low_q)
    high_q_curve = axes.plot_line_graph(x, high_q)
    low_points = low_q_curve["line_graph"].points
    high_points = high_q_curve["line_graph"].points
    points = np.concatenate((low_points, np.flip(high_points, 0)))
    area = Polygon(
      *points, fill_opacity=0.2, stroke_width=0.0, color=color)  # and here
    return VDict({"line": line, "area": area})
Note that I also removed the line around the shaded area with the stroke_with augment.
At this point, the list of available colors might help you.
Set axis limits
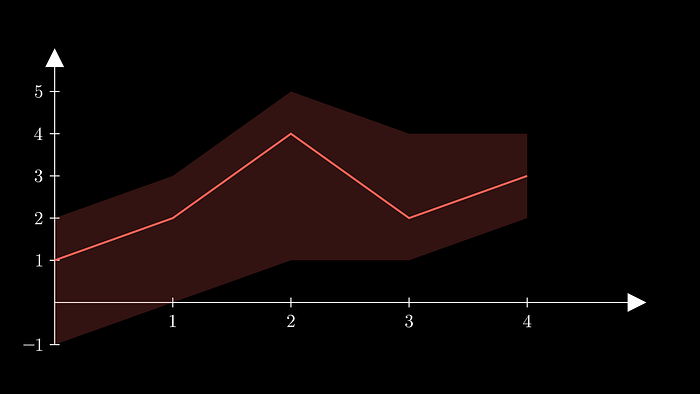
We now adjust the axes according to the data. So we leave our function and look at the axes object. This is what it should look like now:
x_min, x_max, x_step = 0, 4, 1
y_min, y_max, y_step = -1, 5, 1
axes = Axes(
    x_range=[x_min, x_max + x_step, x_step],
    y_range=[y_min, y_max + y_step, y_step],
    # here we set the numbers on the axes.
    x_axis_config={"numbers_to_include": range(x_min, x_max + x_step, x_step)},
    y_axis_config={"numbers_to_include": range(y_min, y_max + y_step, y_step)},
)
Title and labels
Your graph means nothing if you don't add a title and labels on the axes. Here is how to do it.
Title
As simple as that.
title = Text("My beautiful graph")
title.next_to(axes, UP)
Axis labels
Not much more complicated
x_label = axes.get_x_axis_label("x\\text{ label}")
y_label = axes.get_y_axis_label("y\\text{ label}")
Animate

Here we are already at the last part, the most funny one. Here is a proposal of how I will animate the construction of the graph:
self.play(Create(axes), Write(x_label), Write(y_label), Write(title))
self.play(Create(plot["line"]))
self.play(FadeIn(plot["area"]))
Full code
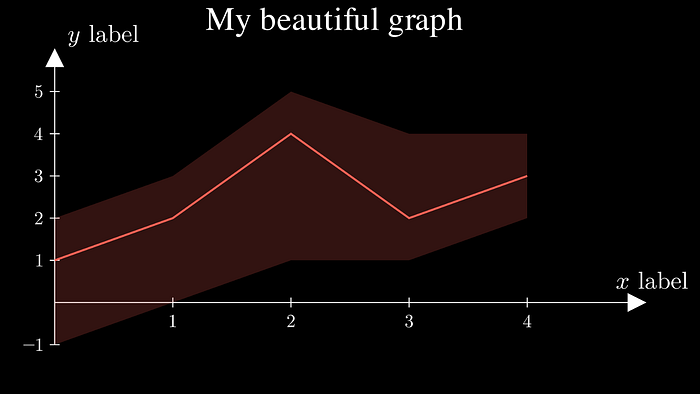
import numpy as np
from manim import *

def build_plot(axes, x, y, low_q, high_q, color):
    line = axes.plot_line_graph(x, y, add_vertex_dots=False, line_color=color)
    low_q_curve = axes.plot_line_graph(x, low_q)
    high_q_curve = axes.plot_line_graph(x, high_q)
    low_points = low_q_curve["line_graph"].points
    high_points = high_q_curve["line_graph"].points
    points = np.concatenate((low_points, np.flip(high_points, 0)))
    area = Polygon(*points, fill_opacity=0.2, stroke_width=0.0, color=color)
    return VDict({"line": line, "area": area})

class MyBeautifulGraph(Scene):
    def construct(self):
        x_min, x_max, x_step = 0, 4, 1
        y_min, y_max, y_step = -1, 5, 1
        axes = Axes(
            x_range=[x_min, x_max + x_step, x_step],
            y_range=[y_min, y_max + y_step, y_step],
            x_axis_config={
                "numbers_to_include": range(x_min, x_max + x_step, x_step),
            },
            y_axis_config={
                "numbers_to_include": range(y_min, y_max + y_step, y_step),
            },
        )
        x_label = axes.get_x_axis_label("x\\text{ label}")
        y_label = axes.get_y_axis_label("y\\text{ label}")
        x = [0, 1, 2, 3, 4]
        y = [1, 2, 4, 2, 3]
        low_q = [-1, 0, 1, 1, 2]
        high_q = [2, 3, 5, 4, 4]
        plot = build_plot(axes, x, y, low_q, high_q, color=RED)
        title = Text("My beautiful graph")
        title.next_to(axes, UP)
        self.play(Create(axes), Write(x_label), Write(y_label), Write(title))
        self.play(Create(plot["line"]))
        self.play(FadeIn(plot["area"]))
        self.wait()
I hope I have explained this clearly. Feel free to comment if you need a boost!