
This article continues a series where we use open-source Data Science tools to analyze alarm and event logs produced by SCADA systems.
This is the third article in the series, previous articles included,
In Processing SCADA Alarm Data Offline with ELK, the following was presented,
- An introduction to industrial control systems (a.k.a SCADA systems), their architecture, and purpose
- The ElasticSearch stack (ELK) was introduced and installed
- Alarm and event logs from a commercial SCADA system were cleaned and loaded into ELK
- A simple analysis of the raw alarm events was completed using ElasticSearch Kibana and simple dashboards created
In SCADA Alarm Standards & Metrics the following was covered:
- Alarm management standards
- The alarm lifecycle
- Alarm system performance metrics
That is where we have been, but where are we going? In this article, we will…
- Examine the alarm life cycle
- Process alarm events into alarm records
- Augment the alarm records with information about the process area and module which is extracted from the alarm tag
- Augment the alarm record with useful statistics
This will enable us in the subsequent article to create dashboards to analyze the alarm records using the industry-standard metrics described in SCADA Alarm Standards & Metrics.
SCADA Systems
As discussed in a previous article, SCADA is a generic term for a computer-based industrial control system. A SCADA (Supervisory Control and Data Acquisition) system can be used to monitor and control industrial processes which can include water treatment, manufacturing, power stations, food and beverage, etc. In fact, any industrial process with automated manufacturing equipment.
Alarms
Definition
The purpose of alarms is to alert operators to unusual or dangerous process conditions that require intervention.
Alarm Lifecycle
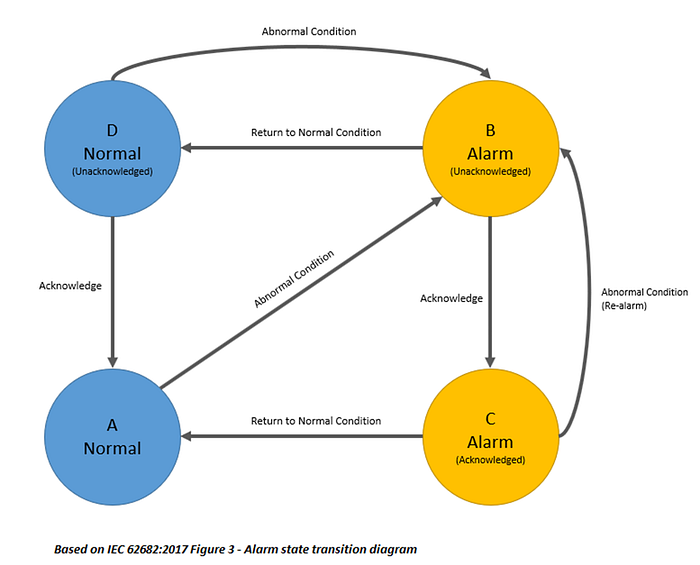
The diagram below presents a simplified alarm lifecycle that is aligned with that presented in the IEC standard.
For each alarm point, the monitored physical process contains two states, normal and abnormal.
So, each alarm will have two attributes, an alarm status (normal | alarm) and acknowledgment status (acknowledged | unacknowledged). Since the alarm has two attributes it can be in one of four states at any time. The allowable state transitions are shown in the diagram below,
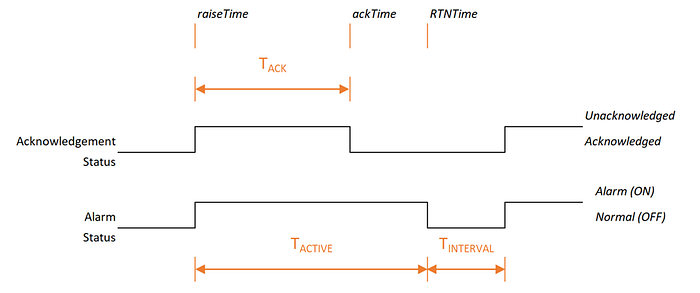
The timing diagram below indicates the typical interaction between the two signals and specifies three, timing values that will be used later in the analysis.
Creating Alarm Records from Alarm Logs
The log files generated by our SCADA system describe each state transition (these were analyzed in Processing SCADA Alarm Data Offline with ELK). To be able to perform a more detailed alarm analysis (as described in SCADA Alarm Standards & Metrics the state transition events will be processed and we will generate an alarm record for the full lifecycle of each alarm.
Format of Alarm Log
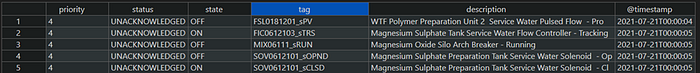
The alarm log files that I have available have been generated by the Schneider Electric CitectSCADA product. The files were originally space-delimited text files, which we have previously converted to CSV. Below is an example of the first five records of a typical file,
Format of Alarm Record
Below is the definition of the Alarm Record that we will store in the Elasticsearch database,
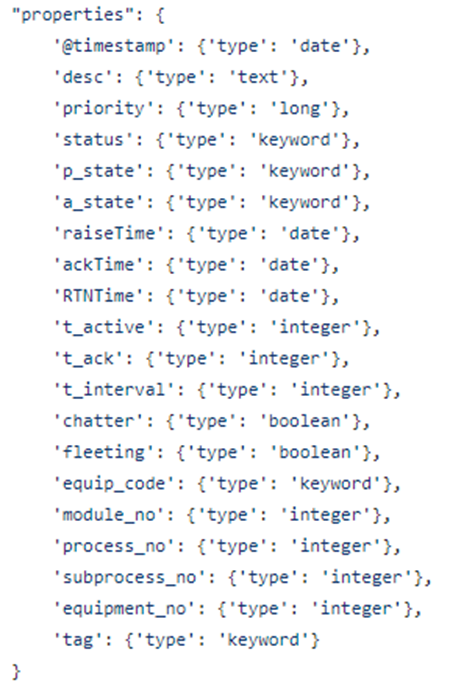
Details of the individual fields as follows,
timestamp:
A timestamp for when the alarm was raised. The is the same value as raiseTime
desc:
Description of the device creating the alarm (e.g., Booster Pump #1 Current)
priority:
A numeric value indicating the alarm priority. For this data set, 1–5.
status:
The alarm acknowledgment status. (This is an internal variable of processing the alarm events and should not have been written to the alarm record).
p_state:
'Process State' corresponds to the Alarm Status. (This is an internal variable of processing the alarm events and should not have been written to the alarm record).
a_state:
Alarm state; A, B, C, or D aligning with the state transition diagram. (This is an internal variable of processing the alarm events and should not have been written to the alarm record).
raiseTime:
A timestamp for when the alarm became active.
ackTime:
A timestamp indicating when the alarm was acknowledged.
RTNTime:
A timestamp that indicates when the alarm transition back to the normal state (Return To Normal).
t_active
The length of time that the alarm was in the active state.
t_ack:
The length of time before the alarm was acknowledged.
t_interval:
The length of time from RTN to the tag again entering the alarm state.
chatter:
A Boolean indicating that this is a Chattering Alarm (i.e. an alarm that triggers >2 times per second)
fleeting:
A Boolean that indicates that this is a fleeting alarm (i.e. an alarm that returns to the normal state before the operator has a chance to act. Taken to be less than 1 second)
equip_code
module_no
process_no:
subprocess_no:
equipment_no:
Additional asset information is described below under Data Augmentation.
Tag:
An alphanumeric identifier for the alarm signal.
Data Augmentation
Many asset numbering schemes embed asset data into the asset identifier. Analysis of alarm records is made easier if the individual components of the asset identifier are extracted and placed into individual fields of the alarm record.
Below is the scheme used in the data being analyzed here,
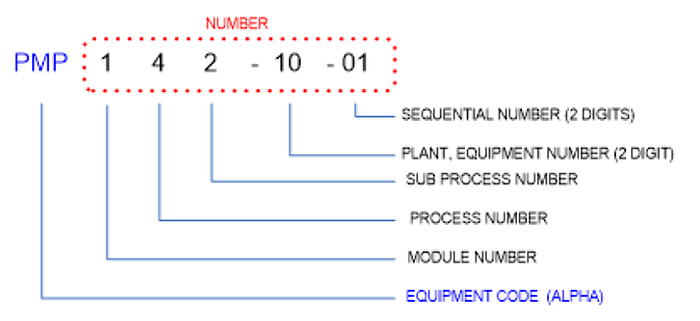
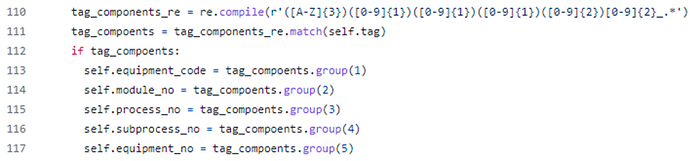
A simple regex expression was used to extract these components,
Code — Record Creation
The code to convert the CSV alarm event data to alarm records is contained in the file, csv-2-record.py which is available in the following Gist.
Main Function
The main function,
- Processes that command line input parameters
- Sets up loops to iterate over all data files
- Reads each data file into a Pandas Dataframe
- Process each row of the Dataframe using a state machine
Data Structure
As we need to process multiple alarm log entries before we have a complete Alarm Record entry that can be written out to file, we need an internal data structure to store the partially processed Alarm Records.
An AlarmRecord class has been created to store the data which includes a writeOut method to write the data out. AlarmRecord class is a Python @dataclass which is a useful library for managing classes that consist mainly of data.
A data variable is used which is a dictionary of AlarmRecords, using the alarm tag as the key.
AlarmRecords that are being processed are stored in the data variable (a Python Dictionary) which is indexed by the alarm tag (which is a unique identifier).
State Machine
To process that alarm log entries a state machine is required.
Since there are only four states, it — then — else constructs have been used to create the state machine. This is about the limit that this would be viable, if there were any more states a more sophisticated implementation would need to be used (The GOF State pattern for example).
We will examine two transitions only.
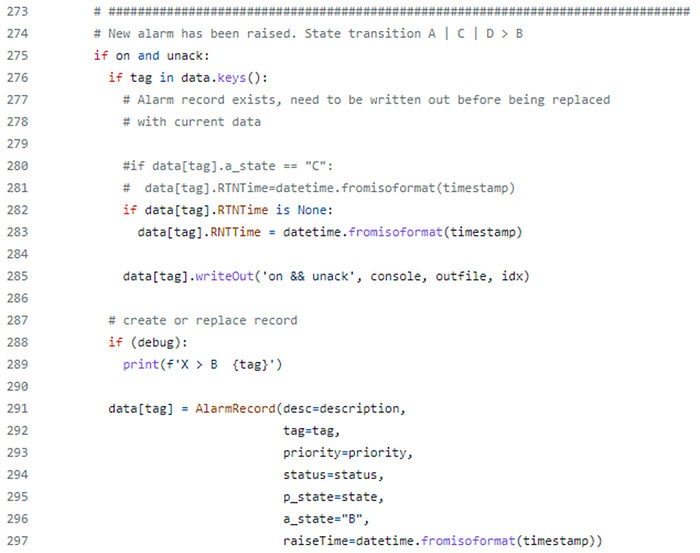
If we process an alarm event where the alarm is active (on is true) and the alarm is unacknowledged (ack is false), then from our alarm state transition diagram we know that we should transition to state B.
This is depicted in the code below,
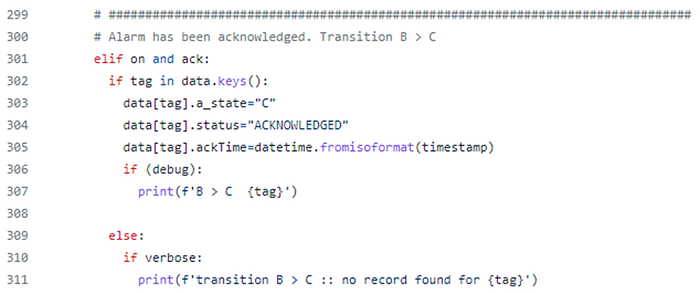
If we process an alarm event where the alarm is active (on is true) and the alarm is acknowledged (ack is true), then from our alarm state transition diagram we know that we should transition from state B to C.
This is depicted in the code below,
Loading into Elasticsearch
The file, csv-record-2-es.py (available in the Gist) is used to load the AlarmRecord CSV files into Elasticsearch.
The code below reads all records into a Pandas dataframe and then uses the bulk upload function in the Python Elasticsearch library to load the data into the database.
Future
To date, we have processed and analyzed our raw alarm log files and created alarm records. In SCADA Alarm Standards & Metrics we saw that the alarm management standards define 12 performance measures for alarm management systems. In the next installment in this series, we will create dashboards using ELK to evaluate our systems' performance against these 12 performance standards.
Resources
The full code is located in the following Gist.
Read Further
Thanks for reading, hope you enjoyed this article.
To explore further,
- Subscribe to email notifications
- Read Part 1 of this series, Processing SCADA Alarm Data Offline with ELK
- Read Part 2 of this series, SCADA Alarm Standards & Metrics
- Click on the 'follow' button at the top of the article
- For all things Industry 4.0, check out my Industrial Digital Transformation & Industry 4.0 publication
- Feel free to join my network on LinkedIn (remember to mention that you have read the article)
To support medium authors, consider a subscription.
Remember to click on the subscribe and follow button,