
How I Use pprof: A Structured 4-Stage Profiling System
As with most things, not knowing which stage you are in will hurt your efficiency. You may end up chasing the wrong bottlenecks, fixing details that do not matter yet, or redesigning components when a small refinement would have been enough. Combine that with an unstructured approach, and it can quickly cost you your sanity.
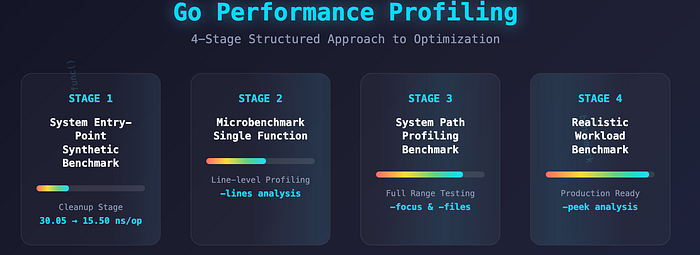
To avoid this, I follow a structured approach to profiling. I start with system entry-point benchmarks to catch the low-hanging inefficiencies, move to microbenchmarks for finer-grained insights, and then use path profiling and realistic workloads for deeper, design-level improvements. This progression ensures that each step builds on the previous one, so I tackle the right performance problems at the right time.
System Entry-Point Synthetic Benchmark
No realistic workload is simulated; the top-level call is repeatedly stressed to reveal performance hotspots.
When implementing a new system design, you inevitably make many small decisions that are too granular to specify in the design and are left to the implementation. The goal of the system entry point benchmark is to identify and clean up these small decisions to improve overall system performance.
For example, you might choose to use Sprintf instead of manual string concatenation, which can result in the following performance difference:
BenchmarkSprintfHotPath-8       42454868        30.05 ns/op      24 B/op       1 allocs/op
BenchmarkStringConcatHotPath-8  74467857        15.50 ns/op      24 B/op       1 allocs/op
Or maybe you didn't consider preallocating the slice and just used append instead:
BenchmarkSliceWithPreallocation-8      8978208      115.9 ns/op       0  B/op       0 allocs/op
BenchmarkSliceWithoutPreallocation-8   353932       3385 ns/op     25208 B/op      12 allocs/op
Individually, these decisions may seem minor, but collectively they can add up to a significant performance cost if not addressed. After repeatedly seeing this pattern, I now start my profiling sessions with what I call the "cleanup stage". Of course you implement a system as well as your current knowledge level allows you to, but the clean up stage gives you the opportunity to learn new things. Most of the work here is simply asking, "Can this be done differently, and would that result in better performance?". Do not assume anything, measure everything and try things out.
Preferred Method
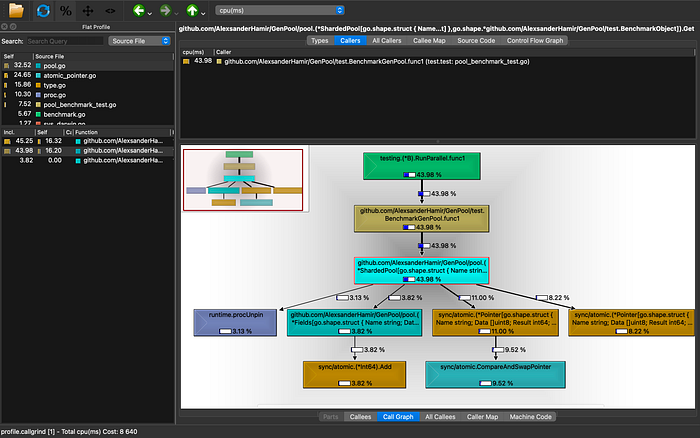
I particularly like using the -callgrind output format so I can analyze profiles with QCacheGrind. For example:
go tool pprof -callgrind cpu.prof > profile.callgrind
qcachegrind profile.callgrind
QCacheGrind provides functionality similar to the standard graph feature in the pprof web interface, but I find it easier to understand and reason about because it feels less noisy. While I am aware of the focus and ignore features in pprof, I prefer being able to get the view I want with a single click. The way the information is displayed also feels more direct and simpler to interpret.
Microbenchmark of a Single Function
After identifying hotspots in your system, focus on a specific candidate for improvement and run a dedicated benchmark for that function alone. This produces a detailed "heat map" of its performance, helping you pinpoint the most costly operations.
For the most part, writing a separate benchmark for a single function is unnecessary. However, if the function is large or complex, not performing a targeted benchmark may cause you to lose valuable performance insights. In such cases, a focused microbenchmark helps capture detailed data that would otherwise be obscured.
Preferred Method
The main option I use here is -lines, which shows line-level profiling information within the function. For example:
go test -bench=BenchmarkMyFunction -cpuprofile cpu.prof
go tool pprof -lines cpu.prof
Example output:
Showing nodes accounting for 500ms, 100% of 500ms total
      flat  flat%   sum%        cum   cum%
    200ms 40.0%  40.0%      200ms 40.0%  mypackage.MyFunction:45
    150ms 30.0%  70.0%      150ms 30.0%  mypackage.MyFunction:52
    100ms 20.0%  90.0%      100ms 20.0%  mypackage.Helper:10
     50ms 10.0% 100.0%       50ms 10.0%  mypackage.AnotherHelper:23
Using the -lines option helps you avoid running different commands to figure out where inside those functions you need to optimize.
System Path Profiling Benchmark
Feed your system with real or synthetic workloads that exercise the full range of branches and cases.
System profiling goes beyond individual function hotspots to reveal how your code behaves across entire execution paths. While a System Entry Point Synthetic Benchmark identifies which functions are expensive within a single path, path profiling captures the range of different outcomes that can result from each entry point, especially when execution varies due to branching or edge cases.
Note: In many cases, path profiling can be simplified or replaced by the system entry point phase. By stressing each entry point, you get a good sense of overall performance, provided the entry points do not have too many branches or edge cases.
This is particularly useful in systems with multiple expensive and complex execution paths. For example:
HandleRequest
 ├─> Authenticate
 │     └─> ValidateToken
 ├─> RouteRequest
 │     ├─> ProcessOrder
 │     │     ├─> ValidateOrder
 │     │     ├─> CheckInventory
 │     │     └─> ChargePayment
 │     └─> ProcessRefund
 │           ├─> ValidateRefund
 │           └─> IssueRefund
 └─> LogRequest
When path profiling isn't useful:
- In systems where execution is mostly linear.
- When alternative paths exist but are cheap or rarely executed.
Preferred Method
1. -files
Shows the source files associated with each function in the profile. Useful to quickly see which files contain performance-critical code.
Example:
go tool pprof -files cpu.profOutput snippet:
flat  flat%   sum%        cum   cum%   file
    200ms 40.0%  40.0%      200ms 40.0%  myapp/handlers.go (ProcessOrder)
    150ms 30.0%  70.0%      150ms 30.0%  myapp/payment.go (ChargePayment)
2. -focus
Filters the profile to only show functions whose names match a given regex.
Example:
go tool pprof -focus=orderLib cpu.profOutput snippet:
flat  flat%   sum%        cum   cum%   function
    120ms 24.0%  24.0%      120ms 24.0%  orderLib.ProcessOrder
     50ms 10.0%  34.0%       50ms 10.0%  orderLib.ValidateOrder
     30ms  6.0%  40.0%       30ms  6.0%  orderLib.CheckInventory
     50ms 10.0%  50.0%       50ms 10.0%  orderLib.ChargePayment
3. -relative_percentages
Shows each node's cost relative to the total samples in the profile after applying any filters. Makes it easier to understand the impact of functions within a focused view.
Example:
go tool pprof -focus=runtime -relative_percentages cpu.outOutput snippet:
Showing nodes accounting for 3.12s, 93.98% of 3.32s total
flat   flat%   sum%    cum    cum%
2.13s  64.16%  64.16%. 2.13s  64.16% sync/atomic.CompareAndSwapPointer
0.58s  17.47%  81.63%  0.58s  17.47% runtime.procUnpin 0
.25s   7.53%   89.16%  0.25s  7.53% runtime.procPin
0.05s  1.51%   90.66%  0.05s  1.51% runtime.usleep
0.02s  0.6%    91.27%  0.02s  0.6% internal/runtime/atomic.(*Uint8).Load (inline)
0.02s  0.6%    91.87%  0.02s. 0.6% runtime.(*gQueue).pushBack
0.02s  0.6%    92.47%  0.02s. 0.6% runtime.chansend
0.02s  0.6%    93.07%  0.02s. 0.6% runtime.pthread_cond_signal
0.02s  0.6%    93.67%  0.02s  0.6% runtime.pthread_cond_wait
0.01s  0.3%    93.98%  0.04s  1.20% runtime.(*timers).run
Without -relative_percentages:
Showing nodes accounting for 3.12s, 36.11% of 8.64s total
Dropped 46 nodes (cum <= 0.04s)
Showing top 10 nodes out of 63
      flat  flat%   sum%        cum   cum%
     2.13s 24.65% 24.65%      2.13s 24.65%  sync/atomic.CompareAndSwapPointer
     0.58s  6.71% 31.37%      0.58s  6.71%  runtime.procUnpin
     0.25s  2.89% 34.26%      0.25s  2.89%  runtime.procPin
     0.05s  0.58% 34.84%      0.05s  0.58%  runtime.usleep
     0.02s  0.23% 35.07%      0.02s  0.23%  internal/runtime/atomic.(*Uint8).Load (inline)
     0.02s  0.23% 35.30%      0.02s  0.23%  runtime.(*gQueue).pushBack
     0.02s  0.23% 35.53%      0.02s  0.23%  runtime.chansend
     0.02s  0.23% 35.76%      0.02s  0.23%  runtime.pthread_cond_signal
     0.02s  0.23% 36.00%      0.02s  0.23%  runtime.pthread_cond_wait
     0.01s  0.12% 36.11%      0.04s  0.46%  runtime.(*timers).run
Combined usage:
go tool pprof -files -focus=ProcessOrder -relative_percentages cpu.prof

OR

go tool pprof -functions -focus=ProcessOrder -relative_percentages cpu.prof
# or -lines instead of -functions
This produces a focused, file-level view of functions matching the target, showing their relative impact within the execution profile. It lets you analyze a specific component or path of your system in isolation, comparing functions only within that scope rather than against the entire program.
Realistic Workload Benchmark
Up until now, most of your efforts should have focused on cleaning and refining your system's implementation. No significant design changes should have been made. Optimizing for a scenario or use case that is not representative of real usage can mislead your efforts. Significant design changes should only come after gaining a better understanding of how the system is actually used and the overall direction of the project. At that point, you can decide whether to specialize for a particular workload or keep a more general approach.
Preferred Method
-peek
This method is preferred because it allows you to focus on a single function and see both its callers and callees. This gives a clear picture of how that function interacts with the rest of the system without being distracted by unrelated parts of the profile.
Example:
go tool pprof -peek="Get" cpu.out
# Shows callers and callees of a specific function
Output snippet:
Showing nodes accounting for 8.64s, 100% of 8.64s total
----------------------------------------------------------+-------------
      flat  flat%   sum%        cum   cum%   calls calls% + context
----------------------------------------------------------+-------------
                                             3.80s   100% |   github.com/AlexsanderHamir/GenPool/test.BenchmarkGenPool.func1
     1.40s 16.20% 16.20%      3.80s 43.98%                |   github.com/AlexsanderHamir/GenPool/pool.Get
                                             0.95s 25.00% |   sync/atomic.CompareAndSwap
                                             0.71s 18.68% |   sync/atomic..Load (inline)
                                             0.33s  8.68% |   github.com/AlexsanderHamir/GenPool/pool.IncrementUsage
                                             0.27s  7.11% |   runtime.procUnpin
                                             0.10s  2.63% |   runtime.procPin
                                             0.04s  1.05% |   runtime.newstack
----------------------------------------------------------+-------------
On top of using peek, I combine it with all the methods above, along with prof, to organize and track my progress.
Conclusion
Performance work is an investigation. The simpler the case, the more people can contribute. But as a system becomes more optimized — and the requirements more demanding — fewer people will have the expertise to push it further. Still, good organization can make the journey much easier, and curiosity will definitely take you far, even if you didn't know much when you started.