
I'm a sucker for features that are native to an app that I'm using and recently I've been learning how mermaid diagrams work in Obsidian. (I have been told about Excalidraw, but I draw horribly with my mouse and you need to download the Excalidraw plugin for it to work in Obsidian.)
Update Sep 2023: What if your mermaid diagram is too big? You can change it's size dynamically using css code. More details in the comments for this story.
What's Mermaid
It's a way of creating diagrams using simple markup language. No drawing skills needed! No additional installation is needed either. Most useful for quickly jotting down a sequence of steps or a set of interconnected relationships.
Here are the two diagrams I use the most, as the syntax and variables they require are easy to remember.
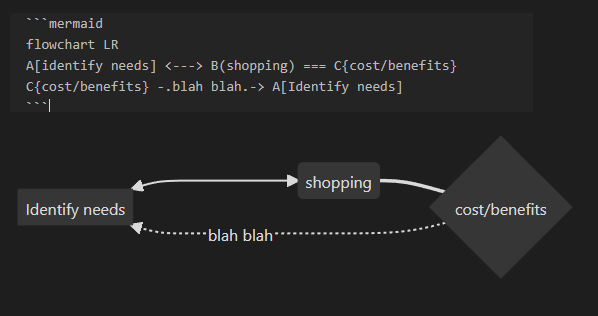
A Simple flowchart / graph
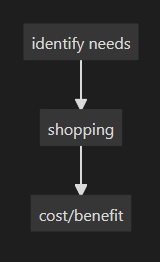
The syntax used is:
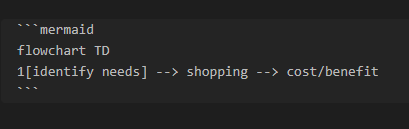
The first thing to tell mermaid is that you want to create a flowchart. There are other types of charts, more on that below.
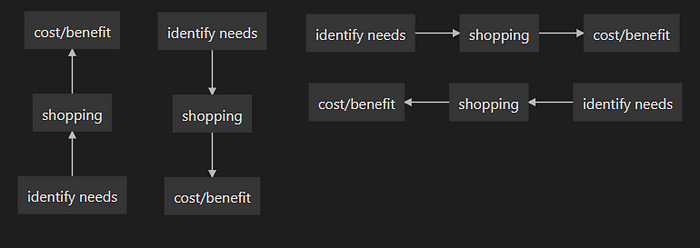
The second thing is to declare which direction the chart should progress. You have a choice of TB (Top-Bottom), LR (Left-Right) or their opposites, BT and RL.
Then you can start adding the nodes you want and what sort of connection they have.
The most simple node consists of a single word. But if you want to have multiple words in one node, they need to be enclosed with square brackets and any alphanumeric string. I used "1" here, but even "Elephant" will work!
You also need to use an alphanumeric prefix and specific brackets if you want to change the shape of the node:
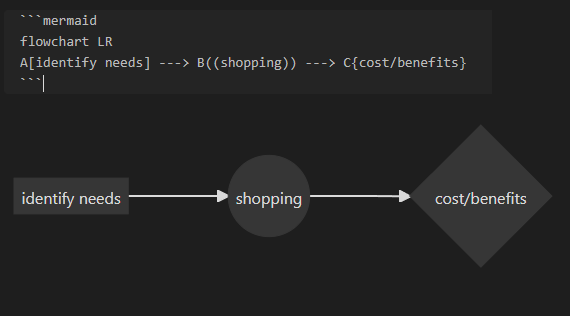
Lastly, you can show different and multiple relationships between the nodes. You can change the thickness of the links and whether there should be arrows. You can also add text to state the nature of the link.
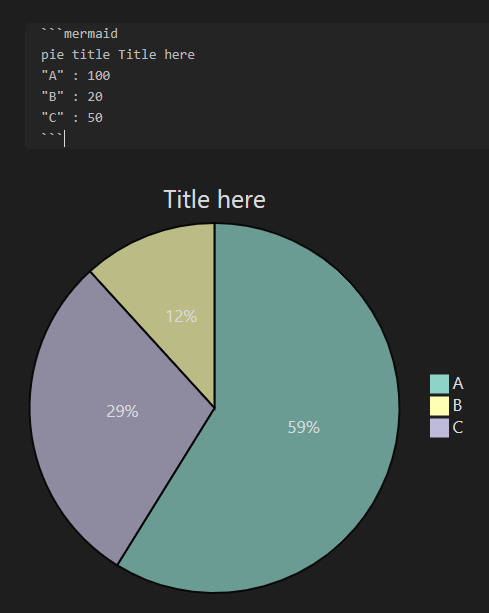
Pie chart
The pie chart works largely the same way, but with even fewer details needed. You just need to indicate groups and each group's share of the pie.
Other diagrams that work well in Obsidian
There are a whole list of other interesting charts in Mermaid. But I have found that the syntax becomes more complicated, meaning that I'm less likely to use them on the fly. More details on how to use them and the other diagram types I didn't share here.
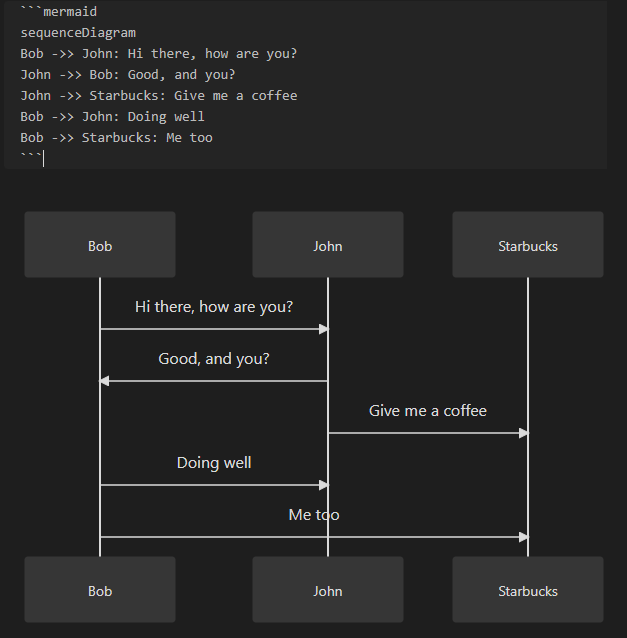
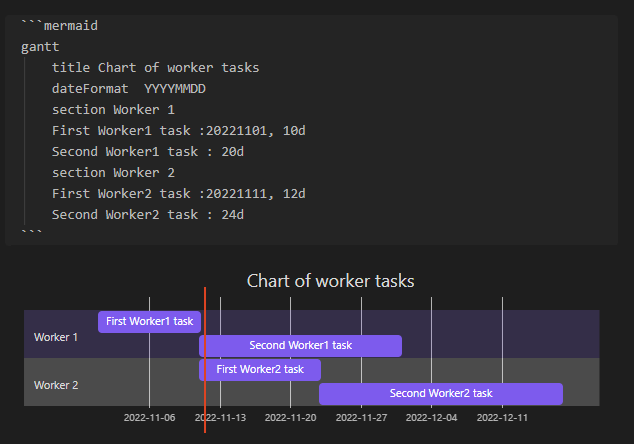
Below I've shared two other sorts of diagrams which I think work pretty well in Obsidian. All of the diagrams can have different colours, shapes etc if you feel like playing around with those.
Sequence Diagram
Gantt Chart
Take a look at the rest of my articles on Obsidian: