

After living in Beijing for a few years, there is no denying that on many days, the smog levels were unbearable.
When my daughter was born there, we had HEPA air filters installed to ensure that she was always breathing clean air.

When living in these conditions, it is tough not to feel some resentment towards the industrial complex of China that is producing this smog in such large amounts.
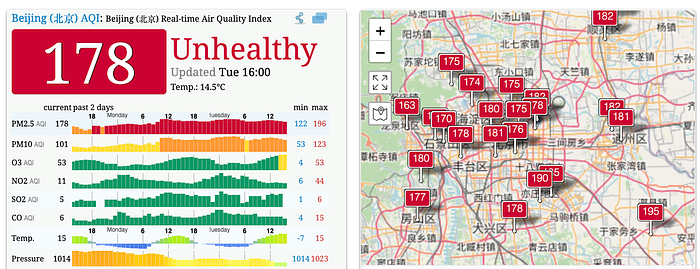
Stories out of China regarding pollution levels most often occur when it gets really bad. Even today, as I write this article, I can see it is not a great AQI day in Beijing:
It is easy to find data to support the position that China leads the world in CO2 emissions and that it needs to improve its air quality standards.
And most of this data is numerically accurate, but it doesn't tell the full story.
In other words, perhaps there is more to this data story than just the CO2 and AQI numbers that are reported when the conditions are really bad.
Let's dig in a little deeper.
The Global CO2 Picture: Different Sides To The Story
To start off with, let's find some data set that we can work with. When I am presenting my workshops on data storytelling, I talk about dramatic effect.
A great data visualization for creating drama is what we in Canada call "the hockey stick" chart:
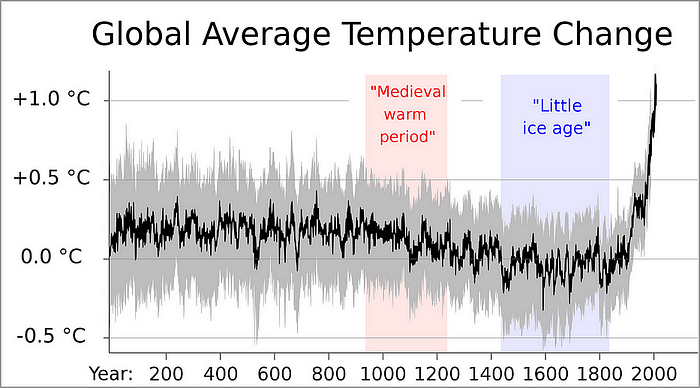
Now your audience is paying attention. There is no doubt that global warming due to CO2 emissions is a thing.
And when we combine it with charts like this stacked area chart:
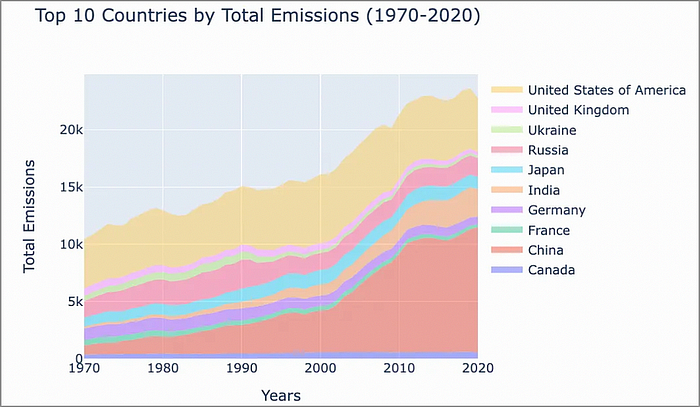
We can see that the total CO2 emissions from China have increased quite dramatically over the past 50 years — even relative to most other countries.
Now the entire world has grown in population, and China has certainly become more industrialized. China leads the world in manufacturing goods. But there is an important question to ask about all of this production:
Who are all the manufactured goods for?
We can look at Chinese exports vs imports to get a better idea of this.
For example, Chinese trade with the EU is at a significant imblance, and even more so recently:
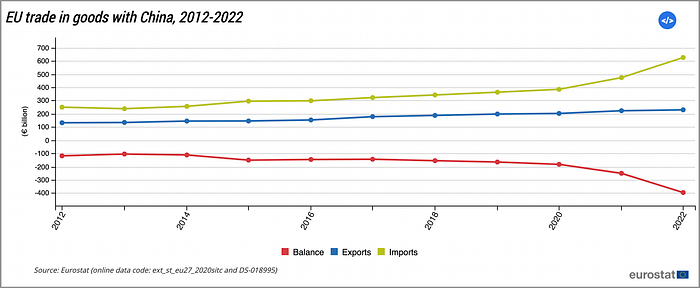
While the EU has an increased reliance on Chinese imports, this is not reciprocated by China.
And if we look at the data to include other parts of the world:
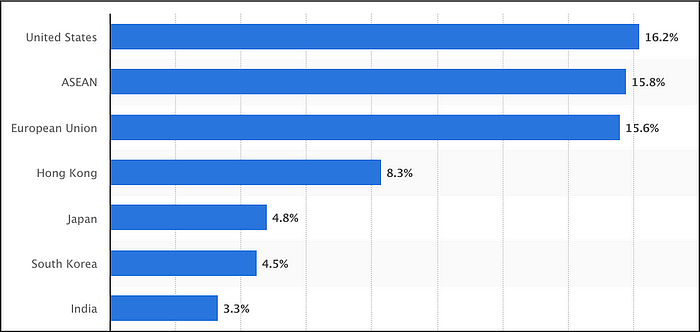
The United States imports even more from China than the EU.
And if we look at a breakdown of Chinese exports:
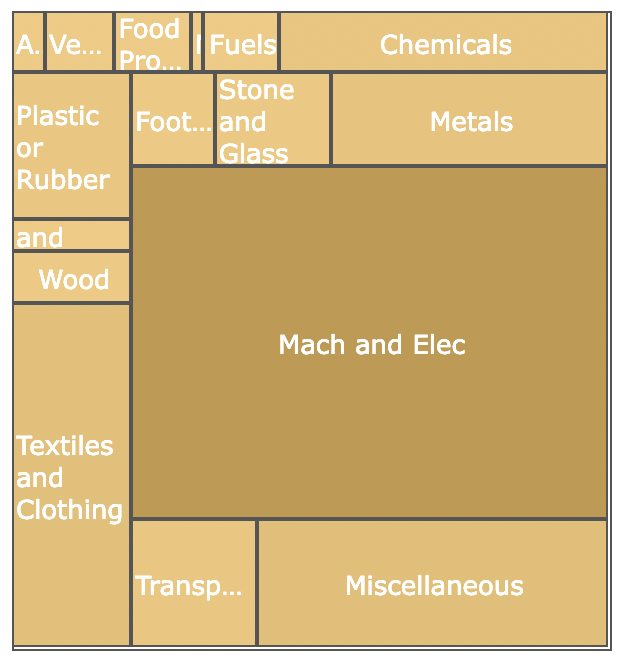
We can see that machinery and electrical is a huge portion. As a large number of Chinese factories are producing goods purely for export, this means that the pollution generated is not "domestic" pollution.
In other words, Western nations are using China to do their "dirty work" for them. In the name of cheaper costs, cheaper labour, AND cleaner air.
Which brings me to the final chart I want to present here:
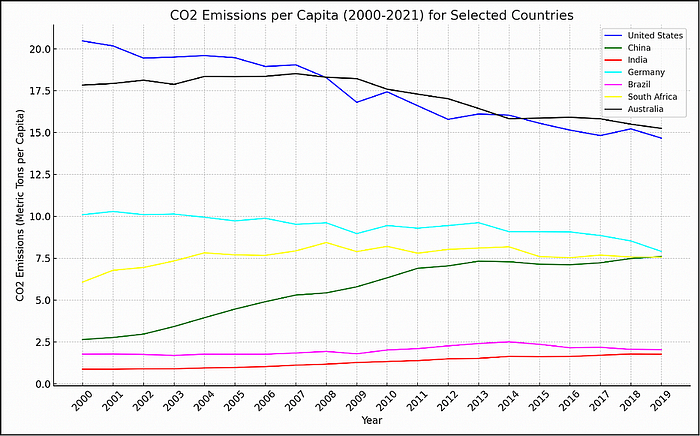
China is still significantly lower than most developed countries in regards to per-capita CO2 emissions.
And that "upward trend" in per-capita emissions for China is alarmingly consistent with the reliance of western nations (ie. the EU, USA, Canada) on Chinese manufacturing.
Now this is certainly not the whole story, but it is an integral part that needs to be included.
And Don't Forget The Biking
And another seldom-told side story, there are more people biking in Beijing than I have seen anywhere else in the world — including bike-friendly Euro-cities like Amsterdam.

In fact, China leads the world in number of bike riders. There are some wide-ranging figures I found on the number of bikes in China. Ranging from to 300–700 million bikes (and e-bikes), with around 200–300 million that are in regular use.
So if we go somewhere in the middle of these numbers, that is still an incredible number of bikes/e-bikes.
And the reality is even today, most folks in China can't afford to buy a car. The percentage of car owners in China is still very low — only around 20%. As a comparison, estimates in Canada put car ownership at around 80%.
So when you get right down to the numbers, it becomes pretty clear that the average Chinese citizen is just nowhere near the consumption level of an average person from the EU, USA, or Canada.
In Summary…
With the goal of removing bias and improving accuracy, this narrative aims to tell a deeper data story about China's pollution and CO2 emissions levels.
We backed our discussion by providing some solid data from reliable sources, examining export figures to the EU and US, showing China's significant role in global manufacturing for western consumption.
We emphasized the importance of looking beyond headline CO2 figures, using per capita emissions data to provide a clearer picture of individual contributions to global emissions.
As data scientists, the ultimate big-picture goal of any story you are telling about data is to provide balanced and accurate results.
Remember that it is your integrity and reputation that are at stake if you don't.
Thank you for reading.
If this type of story is right up your alley, and you want to support me as a writer, subscribe to my Substack.
On Substack, I publish a bi-weekly newsletter and articles that you won't find on the other platforms where I create content.