

You know those bugs that sneak past your tests, your code reviews, and your optimism — and then announce themselves on a dashboard? Yeah. This was one of those.
The Graph That Didn't Feel Right
I have a weekend habit — scrolling through our monitoring dashboards, just looking for patterns. Not hunting for issues necessarily, but trying to understand the system's behaviour visually.
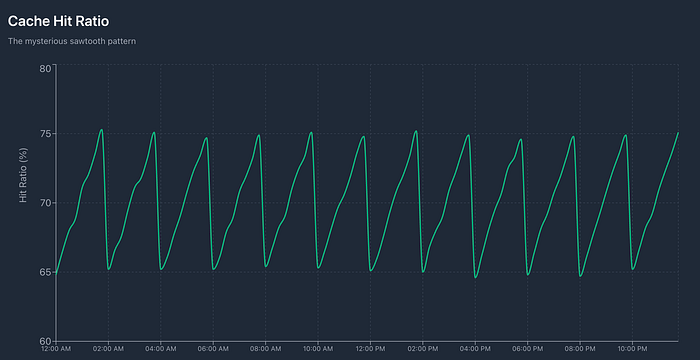
One morning, in the middle of that routine, I noticed something odd in our cache hit ratio graph — a clean, repeating sawtooth pattern.
The ratio climbed gradually over hours, then dropped sharply, then climbed again, over and over. It wasn't random noise. It was precise, rhythmic — too mechanical to be natural load variation.
At first, it didn't seem critical; overall metrics looked healthy. But the pattern bugged me. Why would cache hits consistently fall and recover in cycles? It hinted at some state being reset periodically.
So, I decided to dig.
The Setup
This is a simplified version of our search engine:
- Configurations for every marketplace-category pair were stored in the DB.
- These configs decided parameters like how many products to fetch from the index and how many to cache.
- To improve latency, these configs were cached in memory and shared across requests through a singleton object.
The Special Category
One of our categories had very high volatility — products frequently going out of stock or being replaced.
So we decided to prefetch more products for it, logic was simple:
Fetch more → rerank later → fewer cache misses.
We rolled it out. Metrics looked great. And for a while, everything was shiny.
The Debugging
We noticed that after a few requests, all categories started fetching more products than expected. Cache hit ratio dropped, and CPU utilization spiked (because we were now processing more results).
The next cache refresh cycle brought things back to normal. Then another dip. Then back up. A perfect repeating pattern.
It smelled like a state leak, something persistent across requests.
We started tracing through the request lifecycle, checking whether any shared object was being mutated.
After some tracing, I found the culprit in an innocent looking piece of code — something added weeks earlier for a special case.
// Sample code for replicating behaviour
func handleSpecialCategory(reqConfig requestConfig, req request) {
  if req.Category == "special-category" {
    reqConfig.CategoryConfigs.ProductCount = 10 // instead of default 5
  }
}
The logic was sound. Fetching more products gave us better reranking and fewer "out of stock" hits.
But the implementation had a hidden flaw!!
reqConfig.CategoryConfigs wasn't a local copy — it was the shared reference of our in-memory configuration object.
By updating it, we silently modified the global configuration for every request.
So, after a request from that "special-category" came in:
ProductCountbecame 10 globally.- All subsequent requests fetched 10 products instead of 5 — even if they didn't need to.
- Cache keys (and, therefore, hits) changed.
- Cache misses increased gradually.
- When the background refresh rewrote the config from DB, it reset to 5, recovering cache hits.
- The next special-category request triggered the cycle again.
That rhythmic pattern I'd noticed? It was literally the graph painting this recurring bug.
The Fix
The resolution required only a one-liner, create a request-local copy before modifying configuration values:
func handleSpecialCategory(reqConfig requestConfig, req request) {
if req.Category == "special-category" {
reqConfig.CategoryConfig = deepCopy(reqConfig.CategoryConfig)
reqConfig.CategoryConfigs.ProductCount = 10 // instead of default 5
}
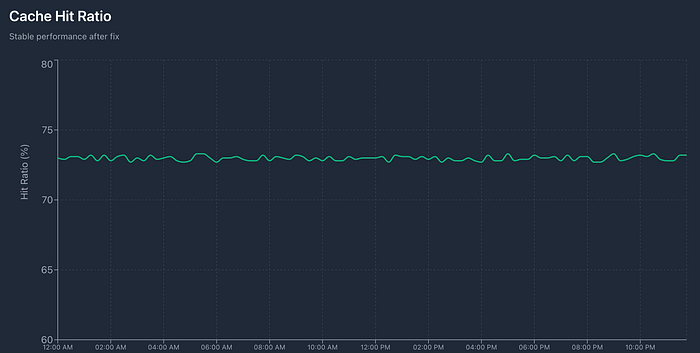
}After deploying the fix, the sawtooth vanished. The cache hit curve flattened beautifully, stable and predictable again.
The Lesson
What fascinates me about this incident isn't the bug itself — it's how it stayed hidden. No alerts fired, no one complained, and yet, silently, system efficiency oscillated for weeks.
The only reason it surfaced was curiosity — taking the time to observe patterns in dashboards not just for alerts, but for understanding.
A lesson I walked away with:
- Shared state is silent until it isn't. Singleton caches are convenient but easy to accidentally mutate
- Immutability is your safety net. Always copy before you customize.
- Graphs tell stories. That sawtooth wasn't noise — it was the system whispering "I'm being mutated."