
Introduction
In the previous section, we set up an isolated environment for malware analysis. In this section, we'll install the ELK stack components and demonstrate how to perform dynamic malware analysis using this setup.
These installations are shown for Debian packages.
ELK Stack
The ELK Stack is a general architecture for collecting and visualizing logs. Its overall structure is as follows:

From the components shown in the image:
Beats: Think of Beats as the heartbeat agents of your system. We install small agents on servers, devices, or applications, and they collect data, package it, and send it to Logstash or Elasticsearch. There are different types of Beats, for example:
- Filebeat → Collects log files (e.g.,
/var/log/syslog). - Metricbeat → Sends system metrics like CPU, RAM, and disk usage.
- Packetbeat → Monitors network traffic.
- Winlogbeat → Retrieves Windows event logs.
Logstash: Beats send the data, but it's raw. Logstash processes this raw data. Think of it like a kitchen: it chops, filters, adds "spices," and finally serves the data to Elasticsearch. Logstash works on an "input → filter → output" logic:
- Input: Specifies where to get the data from (e.g., Beats).
- Filter: Processes and structures the data (e.g., parsing IP, timestamp, user-agent).
- Output: Determines where to send the processed data (e.g., Elasticsearch).
In Logstash, we write pipelines to make the data clean, meaningful, and ready for analysis.
Elasticsearch: Once Logstash processes the data, it's time to store it. Elasticsearch is the heart of the system. All data is stored, searched, and filtered here. We can query massive volumes of logs in milliseconds.
- Elasticsearch is NoSQL-based and stores data in indexes.
- An index is essentially a collection of logs organized by time or type.
With Elasticsearch, we can:
- Search logs instantly.
- Filter and correlate events.
- Relate different incidents.
In short, it forms the "brain" of the entire system.
Kibana: And now for the visual side. Kibana is the interface where we analyze and visualize the data in Elasticsearch. Graphs, tables, dashboards — all come alive here. With Kibana, we can:
- Search and filter logs.
- Build dashboards.
- Set alerts and track events.
In other words, it's the place where we interact with the data and see "what's happening in the system" in real time.
Installations
Now that we have a clear understanding of the architecture, we can move on to the installation steps.
Elasticsearch Installation
First, we move on to installing Elasticsearch, the core component of the system. To do this, open a terminal on your Ubuntu machine and enter the following commands in sequence:
sudo apt-get install apt-transport-https
curl -fsSL https://artifacts.elastic.co/GPG-KEY-elasticsearch | sudo gpg --dearmor -o /usr/share/keyrings/elastic.gpg
echo "deb [signed-by=/usr/share/keyrings/elastic.gpg] https://artifacts.elastic.co/packages/9.x/apt stable main" | sudo tee /etc/apt/sources.list.d/elastic-9.x.list
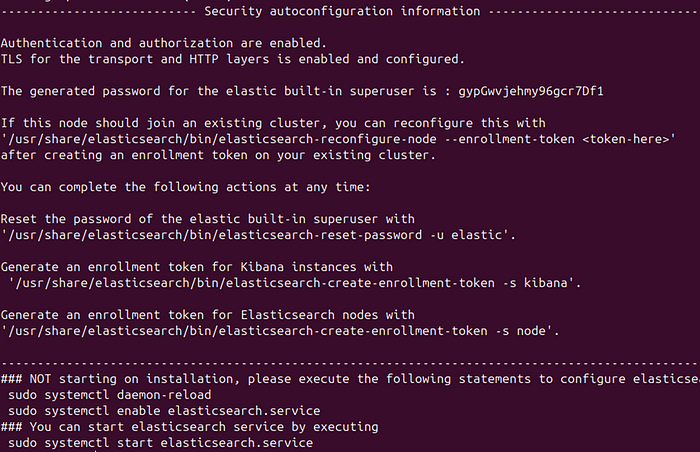
sudo apt update && sudo apt install elasticsearch -yOnce the installation is complete, it provides us with the Elastic built-in superuser password and a set of commands, as shown in the image:
Next, we create an override.conf file at /etc/systemd/system/elasticsearch.service.d/ and add the following content to it:
[Service]
LimitMEMLOCK=infinity
Environment=ES_TMPDIR=/usr/share/elasticsearch/tmp
Next, execute the following commands:
sudo mkdir -p /usr/share/elasticsearch/tmp
sudo chown elasticsearch:elasticsearch /usr/share/elasticsearch/tmp
sudo chmod 750 /usr/share/elasticsearch/tmp
Then, open the Elasticsearch configuration file by running:
sudo nano /etc/elasticsearch/elasticsearch.ymland add the following settings inside the file:
path.data: /var/lib/elasticsearch
path.logs: /var/log/elasticsearch
network.host: 10.0.20.20
http.port: 9200
discovery.type: single-node
xpack.security.enabled: true
xpack.security.enrollment.enabled: false
xpack.security.http.ssl:
  enabled: false
xpack.security.transport.ssl:
  enabled: false
Lastly, execute the following commands:
sudo systemctl daemon-reload
sudo systemctl enable elasticsearch.service
sudo systemctl start elasticsearch.service
Kibana Installation
Now, to download Kibana, the visual interface we'll use for analysis, run the following command:
sudo apt install kibanaNext, to set a password for the kibana_system user, run the following command:
sudo /usr/share/elasticsearch/bin/elasticsearch-reset-password -u kibana_system Now, to generate Kibana's encryption keys, run the following command:
sudo /usr/share/kibana/bin/kibana-encryption-keys generateNext, to complete the Kibana configuration, open the configuration file by running:
sudo nano /etc/kibana/kibana.ymland add the following settings inside the file:
server.port: 5601
server.host: "10.0.20.20"
elasticsearch.hosts: ["http://10.0.20.20:9200"]
elasticsearch.username: "kibana_system"
elasticsearch.password: "the password we created"
logging:
  appenders:
    file:
      type: file
      fileName: /var/log/kibana/kibana.log
      layout:
        type: json
  root:
    appenders:
      - default
      - file
pid.file: /run/kibana/kibana.pid
xpack.encryptedSavedObjects.encryptionKey: key1
xpack.reporting.encryptionKey: key2
xpack.security.encryptionKey: key3
Finally, run the following commands to ensure the service is up and running:
sudo systemctl daemon-reload
sudo systemctl enable kibana.service
sudo systemctl start kibana.service
sudo systemctl status kibana.service
Let's reset the password for the Elastic built-in user:
sudo /usr/share/elasticsearch/bin/elasticsearch-reset-password -u elastic We note down the generated password to log in to the system. Then, open a browser and go to http://10.0.20.20:5601, and log in using the elastic user and the password we created.
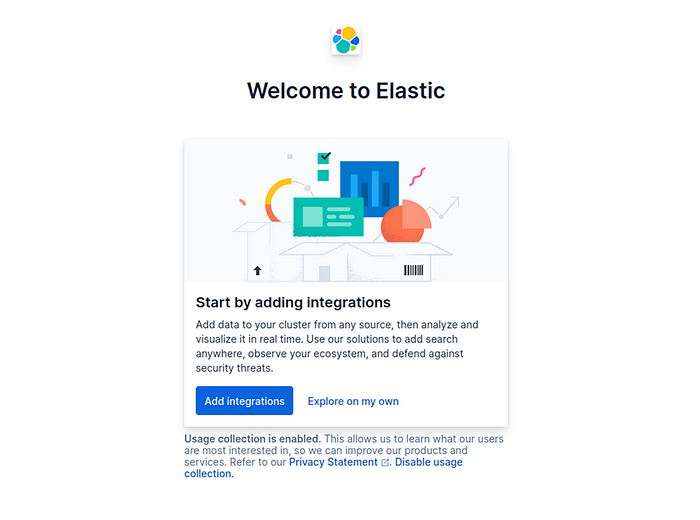
After logging in, you'll be greeted by a page prompting you to "Add Integrations.":
Before adding integrations, it's a good idea to create a new user with the permissions you need and log in with that account. The elastic user has fixed privileges, and being on the default account can prevent you from performing certain actions.
Once that's done, we can continue from where we left off by clicking Add Integration and proceed to set up the Fleet Server:
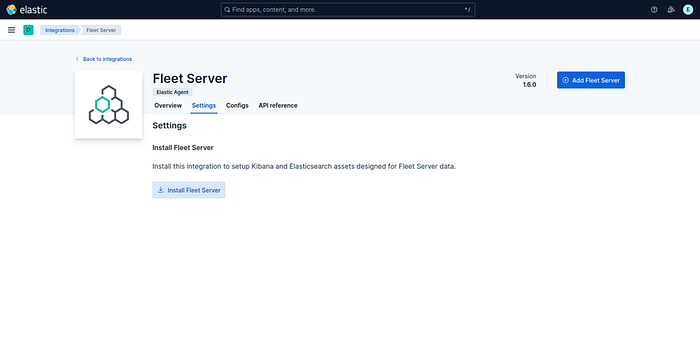
After clicking Install, click Add. Here, provide an Integration Name and a Policy Name, then continue:
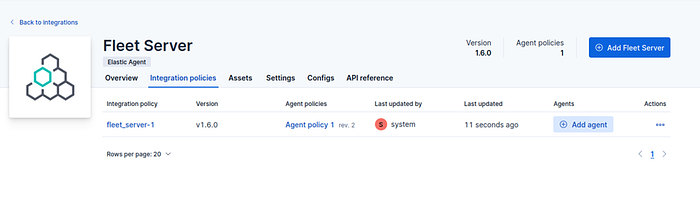
Next, on this screen, click Add Agent and choose the type of device you want to monitor. Copy the provided commands and install the agent on the desired host.
When the agent is first installed, it only has the System Integration enabled. To collect specific data, you can add integrations such as Windows depending on what you want the agent to monitor.
To give the agent EDR capabilities, go to the Agent Policy you created, click Add Integrations there, and select Elastic Defend:
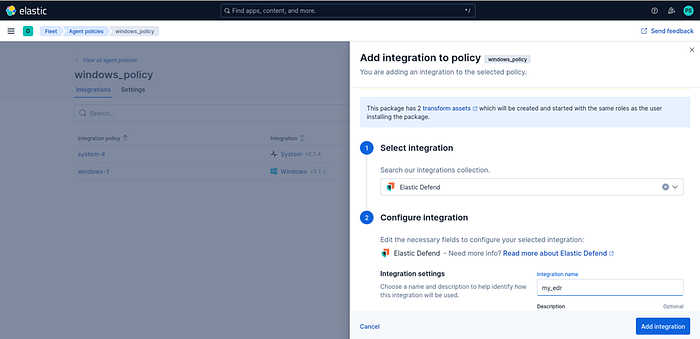
Here, give it a name and click Add Integration to include it. During creation, you can choose whether it behaves like an EDR agent or only has data collection capabilities.
- If you select EDR, you'll get active responses to dangerous situations.
- If you choose Data Collection, it only generates logs.
To better demonstrate behavioral analysis, I'll install the agent with Data Collection so it won't immediately remove the malware I plan to run.
Additionally, after adding the integration, you can click the three dots next to it and select Edit Integration to further customize its settings:
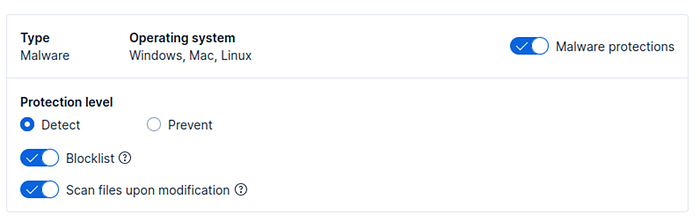
Here I've set the malware protection to "Detect" mode:
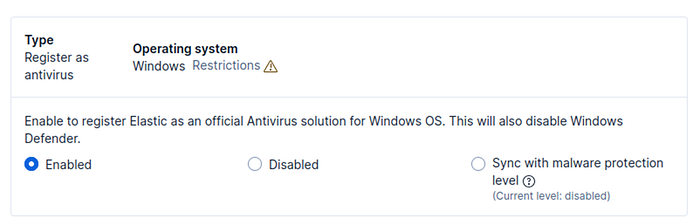
I then scrolled to the very bottom and selected Elastic as the primary antivirus. These settings are entirely optional.
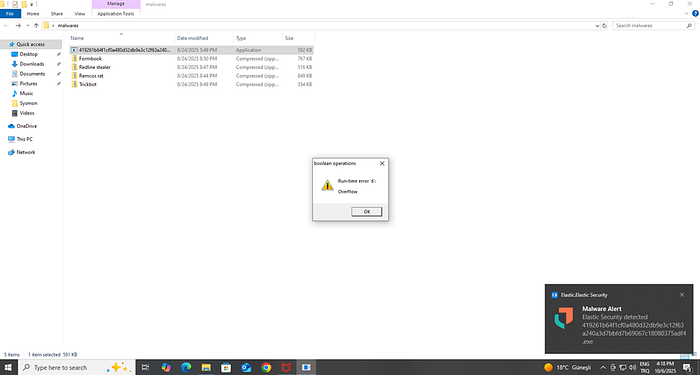
Now our whole setup is complete. Next, let's run a sample piece of malware and observe how it's tracked within the system. As with the initial setup, make sure your environment is isolated.
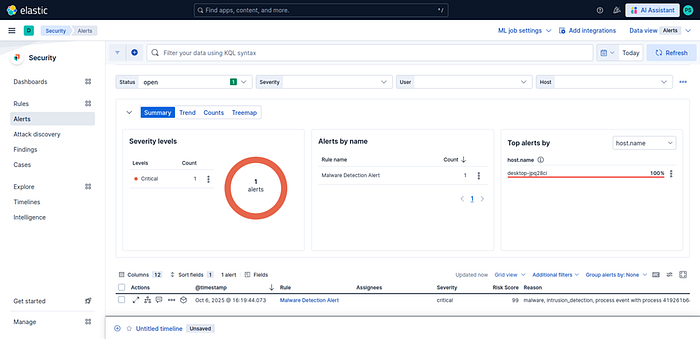
For testing, you can download any malware sample from MalwareBazaar. As you can see, after running the sample I used, Elastic generated an alert on the Windows system:
We also see that an alert has been triggered on the Kibana side:
When we click on the alert and select "Analyze event", we can view the process tree structure as shown:
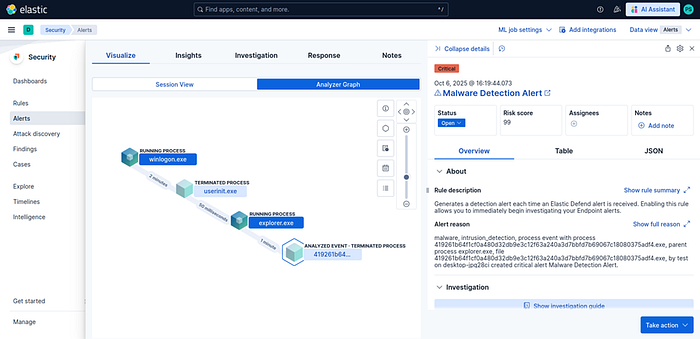
From here we can obtain a wealth of detailed information about the executed file and the processes it spawned, such as timestamps, file paths, and more.
Conclusion
Thus, we've learned how to set up our ELK Security sandbox and how to perform behavioral analysis using this setup. Thank you for reading, stay well.