

Large datasets are challenging to work with. They are even more challenging if you don't have the necessary resources. Most of us don't have access to a distributed cluster, racks of GPUs or more than 8GB of RAM. This doesn't mean we can't get dirty with some big data. We just need to tackle it one piece at a time. That is, iterating over the full dataset working with subsets at a time.
Dataset
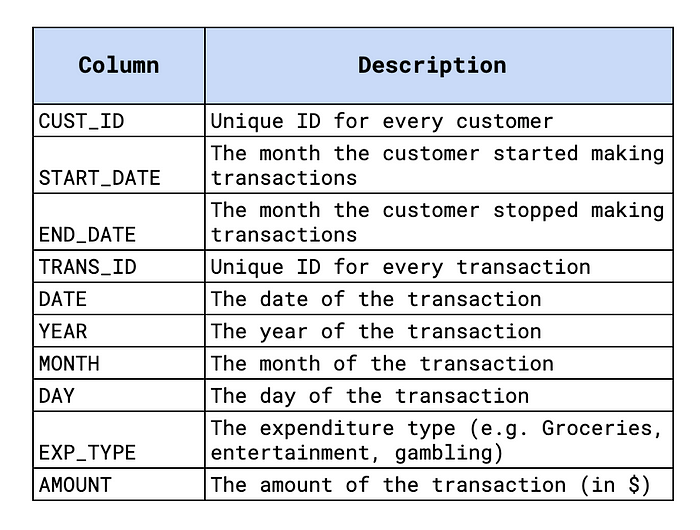
We'll show you how you can do this with a large (randomly generate) transaction dataset. The dataset contains over 260 million transactions for 75,000 customers. Transactions are taken from 2010 to 2020. Each transaction is classified into one of 12 expenditure types (e.g. Groceries). You can see more details in Figure 1 and you find the full dataset on Kaggle. You can also find the notebook for this tutorial on GitHub.
We'll see how you can use batch processing to create different aggregations of this data. Specifically, we are going to calculate:
- Total number of transactions
- Total yearly expenditure
- Average monthly entertainment expenditure in 2020
In the end, we will discuss ways to speed up the process of creating these aggregations.
Batch Processing
We are going to use some standard Python packages. We have NumPy and Pandas for data manipulation and matplotlib for some simple visualisations. Make sure you have these installed.
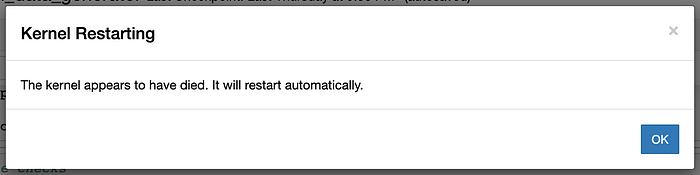
To start, let's try loading the entire dataset with Pandas. After a while, we get the error message in Figure 2. With only 8GB of RAM, it is not possible to load the entire dataset into memory.
To get around this, we can load a subset of the dataset. To do this we can use the skiprows and nrows parameters in the read_csv function. Below we have set the values of the parameters to 1000 and 2000 respectfully. This means we will skip the first 1000 rows of the CSV and load the following 2000 rows. We will also need to pass the column names as a parameter (line 8). This is because we have skipped the first row of names in the CSV.
We can use these parameters to iterate over our dataset. To do this we have created the get_rows function below. This can use the to return a subset of our dataset. Each subset will contain the number of rows determined by the step parameter. The count parameter is varied to return different subsets at each step. To understand how we can use this function, we'll count the total number of transactions in the dataset.
Count number of transactions
We use the get_rows function within a while loop. At the end of each iteration of the loop, we will update the count (line 19). This means we will load a new subset of the dataset (line 13). We set the number of steps so that 5 million rows are returned each time (line 1). However, the number of rows in the dataset is not a factor of 5 million. This means that for the last iteration less than 5 million rows are returned. We can use this to end the while loop (lines 22–23).
For each iteration, we calculate the length of the subset and add it to the total number of transactions (line 16). In the end, we output that there are 261,969,720 transactions. With a good understanding of how we can process our dataset in batches, we can move on to more complicated aggregations.
Total yearly expenditure
For this aggregation, we want to sum all the transaction amounts for each year. We can follow a similar process to before. Expect now, for each iteration, we want to update the total for each year in our dataset. We start by creating a pandas series where the index is the year and values are the total expenditure amounts (line 2). We start with a total expenditure of 0 for each year.
For each iteration, we sum the expenditure amounts by year (line 10). The result is another series, exp, with the same index as total_exp. This allows us to loop over each year and update the totals (lines 13–15).
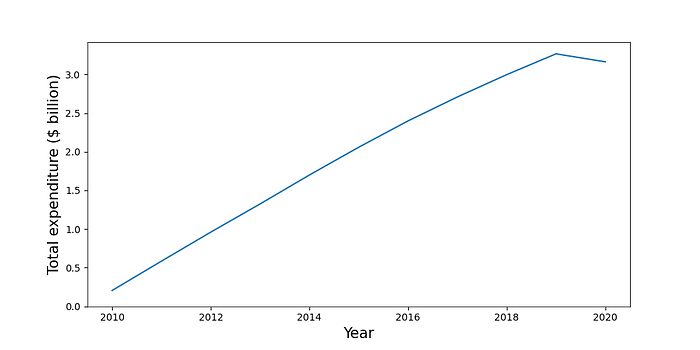
We visualise this aggregation using the code below. You can see the output in Figure 3. Except for 2020, the total expenditure is increasing steadily year on year. For this aggregation, all of the calculations are done within the while loop. As we will see for the next aggregation, this is not always the case.
Average monthly entertainment expenditure in 2020
For many aggregations, we won't just be adding to a total amount. For this aggregation, we first need to calculate the total amount spent on entertainment by each customer each month. Then, for each month, we can calculate the average across all customers. To start, we create an empty pandas data frame (line 2).
For each iteration, we then filter out the transactions so only those for entertainment in 2020 remain (line 10). We then sum the amounts by customer and month (line 11) and append this table to total_exp (line 14). After doing this a customer and month can be repeated. This is because not all of a customer's transactions will necessarily be captured within one iteration. This is why we aggregate the table again (line 17).
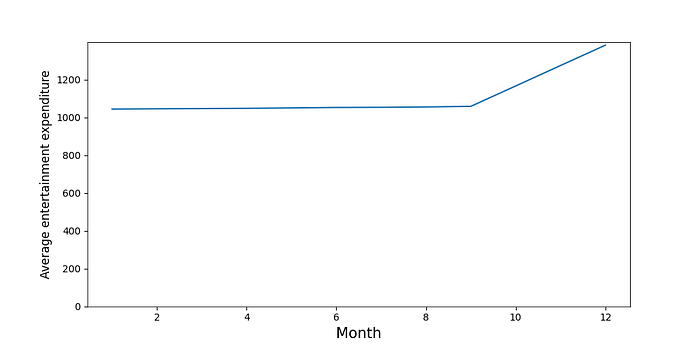
In the end, we will have a table with monthly totals for all the customers. The last step is to calculate the average amount for each month (line 26). You can see these averages in Figure 4. Here the average is stable and then increases in October, November and December.
Nothing but time
So, even with limited resources, we are to analyse this large dataset. The biggest issue is the amount of time it takes to run each aggregation. On my machine, aggregations took about 50 minutes each! It's important to try to speed things up as much as possible.
The piece that takes up the most time is where the rows are loaded using the get_rows function. Here we are loading data from the CSV on our hard drive to memory/RAM. So, instead of using multiple while loops, you should try to do many aggregations within the same loop. This way we will only need to read data from the disk once.
I hope you found this article helpful! You can support me by becoming one of my referred members. You'll get access to all the articles on Medium and I'll get part of your fee.
You can find me on | Twitter | YouTube | Newsletter — sign up for FREE access to a Python SHAP course
References
C O'Sullivan, Simulated Transactions, CC0: Public Domain https://www.kaggle.com/datasets/conorsully1/simulated-transactions