

Data analysis is a time-consuming task.
It requires a working knowledge of complicated Excel formulas and some programming expertise.
When analyzing data, I used to spend hours debugging code and scouring through online tutorials to get my desired result.
Until recently!
ChatGPT is a game-changer in the data analytics space.
Even if you don't know Excel and can't write a single line of code, ChatGPT puts the capabilities of a junior data analyst at your fingertips.
All you need to do is ask ChatGPT a question in plain English.
The model will then use its natural language capabilities to analyze your data and solve the problem.
In this tutorial, I will show you how you can turn ChatGPT into your own personal data analyst.
To follow along to this tutorial, you must have a paid subscription to ChatGPT Plus.
For a video version, click here.
I know a personal trainer, (let's call him James), who has recently started running his own fitness company.
Due to budget constraints, James needs to manage almost every aspect of the business himself.
This includes, but is not limited to the company's operations, finance, marketing, customer acquisition, and strategy.
Lately, James has started using ChatGPT to make business decisions based on customer data.
You see, although James knows fitness like the back of his hand, he has no experience working with spreadsheets and programming languages.
In the past, if he wanted to perform any kind of data analysis related task, James would have had two options:
- Hire professionals who were good at making sense of raw numbers and analyzing data.
- Spend countless hours learning these skills himself.
Either way, he would have had to spend a lot of time and money.
Now, thanks to ChatGPT and the introduction of the tool's specialized data analysis features, James can analyze data in minutes, taking his business to the next level.
In this article, we will step into James' shoes, and analyze transaction data from his fitness company. We will uncover data-driven recommendations using ChatGPT, and explore how these insights can be used to improve sales.
Advanced Data Analysis
ChatGPT's inbuilt data analysis plugin can analyze documents you upload to it and generate a response in seconds.
This feature was released by OpenAI on July 6th 2023, and is currently only available to ChatGPT Plus subscribers.
The plugin was recently renamed to "Advanced Data Analysis," to make it more aligned with its data analytics capabilities, which is the primary business use-case of this feature.
When you use this data analysis feature and provide ChatGPT with instructions, the model translates your prompt into Python code, runs this code, and gives you the desired result.
This is the equivalent of you writing code to accomplish the task yourself — a process that would take humans years of learning and practice to master.
A small business owner like James would greatly benefit from this plugin, since he lacks the technical skill to work with customer data.
Here is a visual describing how this data analysis feature works:
Step 1: Exploratory Data Analysis
Let's use this plugin to analyze some data.
You can find the dataset for this analysis in this link — the file is titled "James Transaction Dataset." (The dataset for this analysis was created by the author).
This document comprises transaction data related to James's fitness company in the past month.
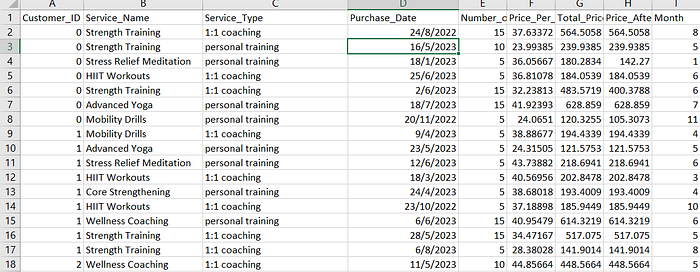
In this Excel file, you can find two sheets with information related to James's fitness company — "Ecommerce Sales" and "Gym Services"
The first sheet, "Ecommerce Sales," looks like this:
It contains the products purchased by each customer, the price of each item, a discount percentage, and the total amount spent.
We will be focusing our attention on this sheet first.
Let's start by uploading the Excel file to ChatGPT by clicking on the paperclip icon on the bottom left of the interface (make sure to select GPT-4 and not GPT-3.5):
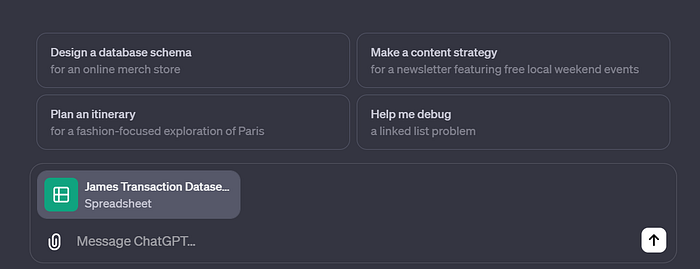
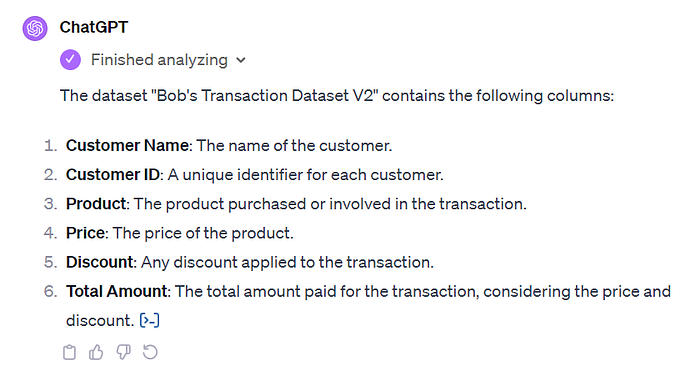
Once the file is uploaded, simply ask ChatGPT to describe the columns present in the dataset:
Can you describe the columns present in this dataset?In just a few seconds, you should see a response that looks like this:
To view the code generated by ChatGPT, you can click on the blue icon at the end of the model's response.
If you know Python programming, you can copy and paste this code and run it yourself.
I tend to do this when I have lots of data to analyze, since ChatGPT can only ingest 10 files at a time.
When working with data, I usually find myself having to analyze hundreds, or even thousands of files. In a situation like that, I just copy the code generated by ChatGPT and write a loop to iterate over all my files.
Getting back to the task at hand, notice that ChatGPT has only given us details about the first worksheet, although there are two sheets in the Excel file.
This is because the chatbot usually generates code to read only the first sheet by default, assuming that it is the most relevant one unless specified otherwise.
If you want it to analyze the second sheet, you're going to have to explicitly state that.
Let's now ask ChatGPT about the unique products that customers have purchased from James:
What are the unique products available in this worksheet?ChatGPT analyzes the sheet to identify all unique products listed, and generates the following response:
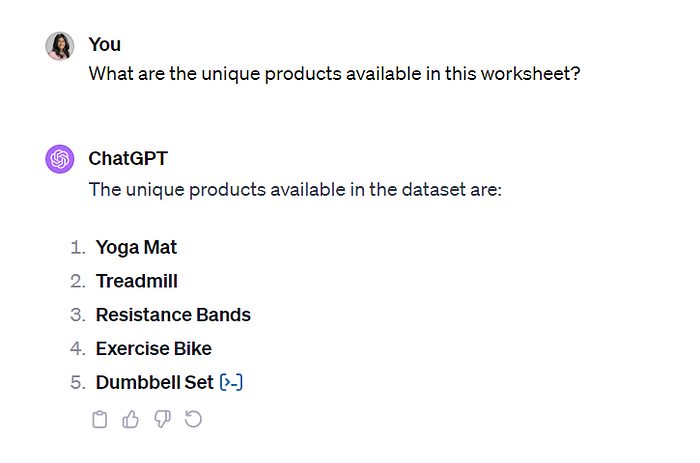
Instantly, we see that James is selling only 5 products in his ecommerce store.
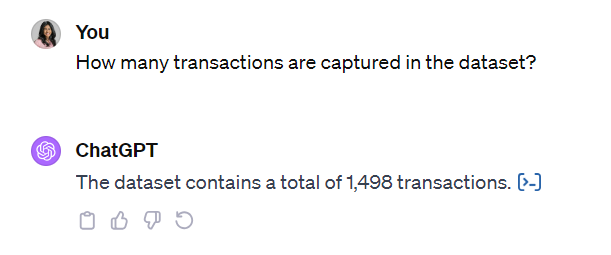
Let's now ask ChatGPT the number of transactions that have been made, to understand how many purchases people have made from James' company in the past month:
How many transactions are captured in the dataset?Here is ChatGPT's response to the above prompt:
Now that we have a basic understanding of the dataset, let's proceed to perform some simple calculations on it.
Step 2: Data Aggregation
Let's start by asking ChatGPT to calculate the total sales made by James from all transactions in the dataset:
What is the total sales amount from all the transactions present in this worksheet?Here is ChatGPT's response to our prompt:
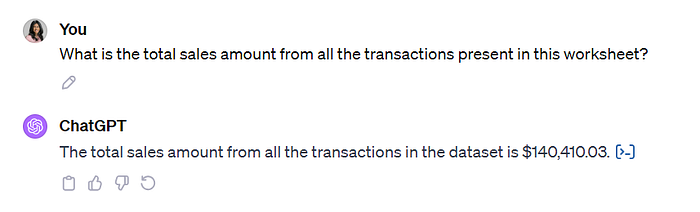
Notice that even without informing ChatGPT about the specific column we'd like to analyze, it identified the correct column, "Total Amount", and has computed the sum.
This showcases its remarkable ability to understand context and translate plain text requirements into precise results.
Step 3: Generating Data-Driven Insight
Now that we've performed some basic computations on the dataset, let's go a step further and ask ChatGPT to provide insights that can help improve James' business strategy.
As a salesperson, it is important to understand which product is selling the best, and whether the product prices and discounts have an impact on the number of purchases made.
To improve his business strategy, James wants to know two things:
- Which of his products are bestsellers?
- Are people's purchase decisions impacted by prices and discounts?
Let's combine these questions into a single prompt:
From the purchase details sheet:

Can you identify which product has been purchased the most in terms of quantity?
What is the average selling price of each product?
What is the average discount given for each product?
Based on the data, is there a relationship between the product's price or discount amount and the number of purchases? Do lower prices mean more sales?
Here is ChatGPT's response to each part of the prompt:
- Can you identify which product has been purchased the most in terms of quantity?
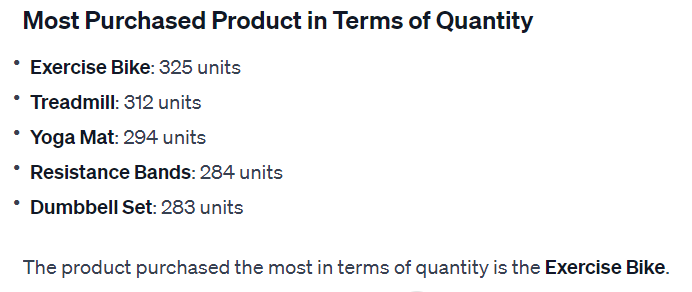
ChatGPT finds that the exercise bike is the most popular product in terms of purchase quantity.
2. What is the average selling price of each product?
The chatbot performs some calculations and lists the average price of each product:
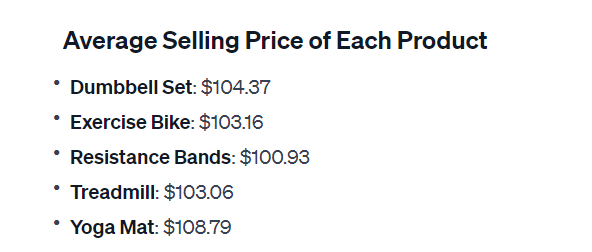
Just by looking at this, we can tell that the selling price of these products are mostly the same.
The exercise bike, which was purchased the most, isn't the cheapest.
This suggests that lower prices don't necessarily translate into more sales.
At least for this item, there isn't a straightforward relationship between the number of purchases and product price.
I'd like to point out that this kind of analysis would require an intermediate knowledge of Excel or programming, since the user would have to group the data or create some kind of pivot table before aggregating it to find the average.
With ChatGPT, however, we got this insight in seconds without having to write any code or Excel formulas.
3. What is the average discount given for each product?
Here is ChatGPT's list of the average discount for each product:
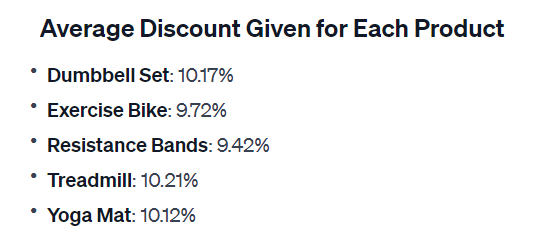
Again, the discounts offered on the exercise bike is lower than the discounts offered on the other products.
This means that higher discounts don't always translate into more sales, especially for this product.
To further analyze the relationship between discounts and purchases, let's proceed to ChatGPT's response to our next question.
4. Based on the data, is there a relationship between the product's average selling price or average discount amount and the number of purchases? Do lower prices mean more sales?
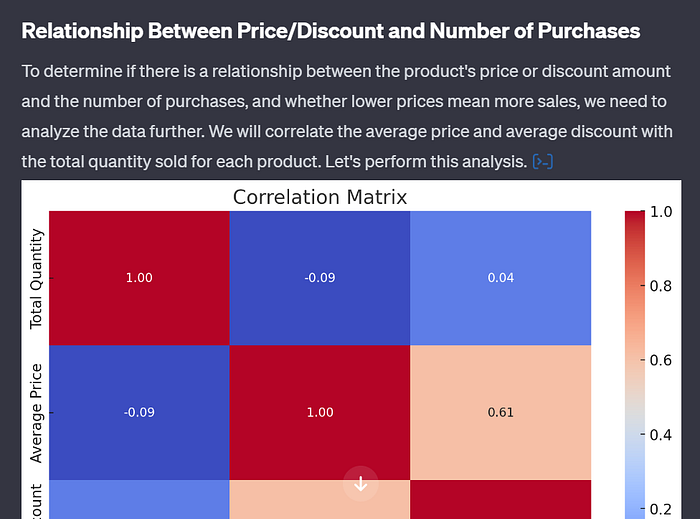
ChatGPT is telling us that in order to understand the impact of pricing and discounts on sales, we'd have to perform a correlation analysis.
Correlation analysis is a technique that quantifies how strong the relationship between two variables is.
We will not be diving deeper into the mechanics behind this technique, since it is outside the scope of this blog post.
But essentially, correlation can tell us whether an increase in price corresponds to higher sales, and if so, by how much.
This statistical technique is generally performed using specialized software or programming tools, which means that traditionally, someone without a background in data analytics or statistics might find it challenging to perform and interpret a correlation analysis.
With ChatGPT, however, you can simply ask it to do the analysis for you and explain the results in simple terms, making a complex analytical task like this more accessible to everyone.
You can read ChatGPT's explanation as to what correlation analysis is if you'd like, but I'm going to skip to the summary.
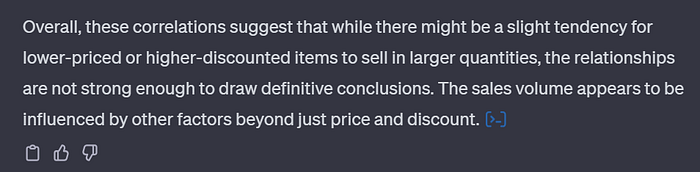
ChatGPT has concluded that based on the results of the correlation analysis, the relationships between product price and discounts on sales aren't strong, indicating that these factors are not primary drivers of sales.
This means that the people buying gym equipment from James aren't really being influenced by pricing or discounts. There are other factors, like product interest, that motivates them to buy from him.
And as a business owner or a decision-maker, this kind of feedback is incredibly valuable, as it can help you rethink your pricing strategy and entice customers to make more purchases.
Step 4: Data Visualization
Now, let's proceed to create some charts with ChatGPT.
We will be using the second worksheet in this file to accomplish this:
This worksheet comprises information about all the fitness classes and training sessions that James's customers have attended.
Let's start by asking ChatGPT to describe the columns present in this sheet:
Can you describe the columns present in the second worksheet?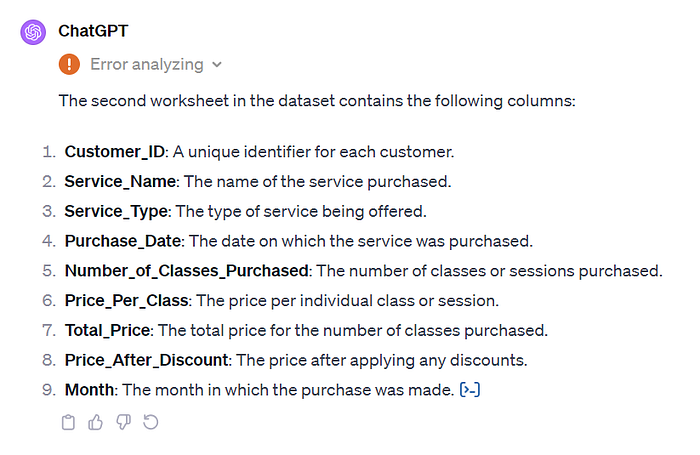
ChatGPT has listed the columns present in this dataset and has given us a description of each of them.
Now, recall that James isn't a highly technical person.
He doesn't know exactly what to visualize in this dataset.
All he knows is that he wants to use the trends found in his previous customer interactions to increase future sales.
He can simply tell ChatGPT this, and leave it to the chatbot to generate visual ideas:
This worksheet comprises transaction information for my fitness company for the past year.
What charts can I ask you to create if I'd like to learn more about my
customer behavior?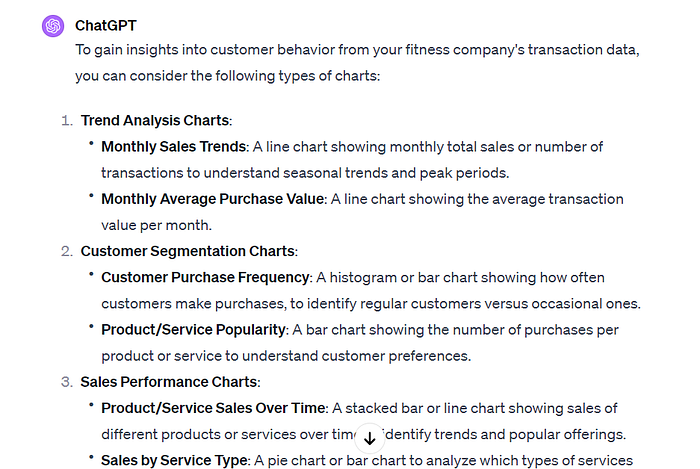
ChatGPT has generated a myriad of visual ideas, such as monthly sales trends, average purchase value, and customer purchase frequency.
For the purpose of this tutorial, let's pick two things to visualize.
First, let's ask ChatGPT to visualize sales trends over time, and come up with recommendations on improving sales based on these trends:
Can you visualize sales trends by month? Based on these trends, provide
detailed insights on key trends and generate actionable recommendations on
how to improve future sales.
In response to the above prompt, ChatGPT generates the following bar chart visualizing sales information:
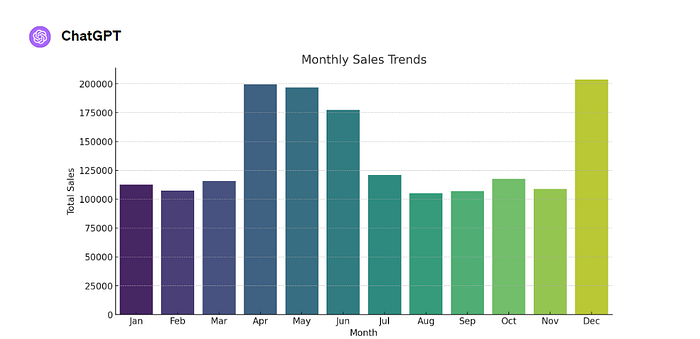
Right off the bat, we see spikes in "total sales" in April, May, and December.
Based on the insights gleaned from the visualization, ChatGPT has also generated a few recommendations as to how James can improve future sales for his fitness company.
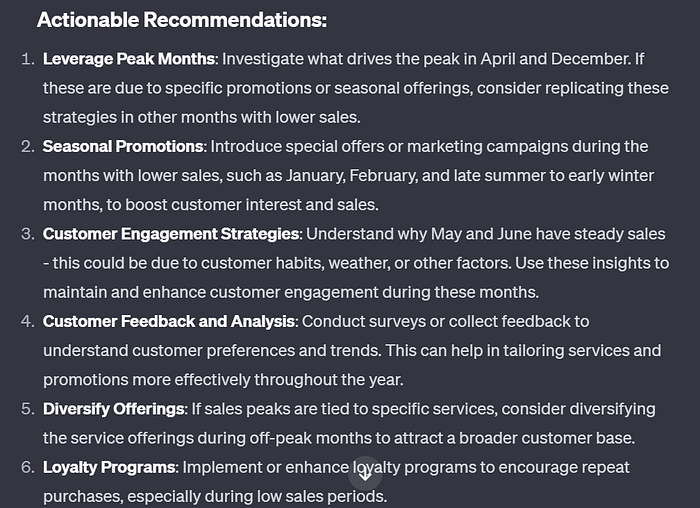
Firstly, the chatbot is recommending that James investigate why sales are higher in April and December.
If the spikes can be attributed to special offers or seasonal promotions, it is suggesting that we replicate the strategy across different times of the year.
Then, it is also suggesting that James introduce special campaigns or offers in months with lower sales.
I'd like to take a step back and point out that the role of a good data analyst is to answer the right questions with data.
ChatGPT has done exactly that with no guidance whatsoever.
It was able to read the dataset, uncover the types of questions to answer, and even generate recommendations to improve James' business strategy.
I'll leave it to you to go through the remaining recommendations generated by the chatbot.
Let's proceed to the next visualization.
We are now going to look at the number of sales by each service, to understand which of James' services are the most popular amongst customers:
Can you visualize the amount of total sales by service? Based on these trends, provide
detailed insights on key trends and generate actionable recommendations on
how to improve future sales.
Here is a chart generated by ChatGPT in response to the above prompt:
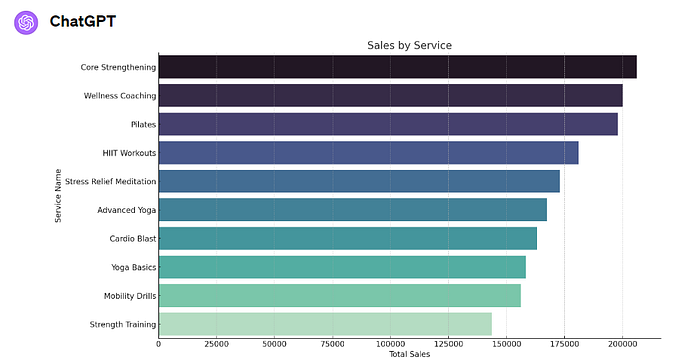
It appears as though "core strengthening" is the most popular class, followed by "wellness coaching."
As a follow up question, it might be worth looking into aspects like seasonal trends. Are people purchasing more of a specific service during the summer, for example?
These insights can be used to carve a personalized targeting strategy to improve customer acquisition and retention.
I'll leave it to you to ask these questions and explore the dataset further, but for now, let's look at ChatGPT's recommendations based on the above chart:
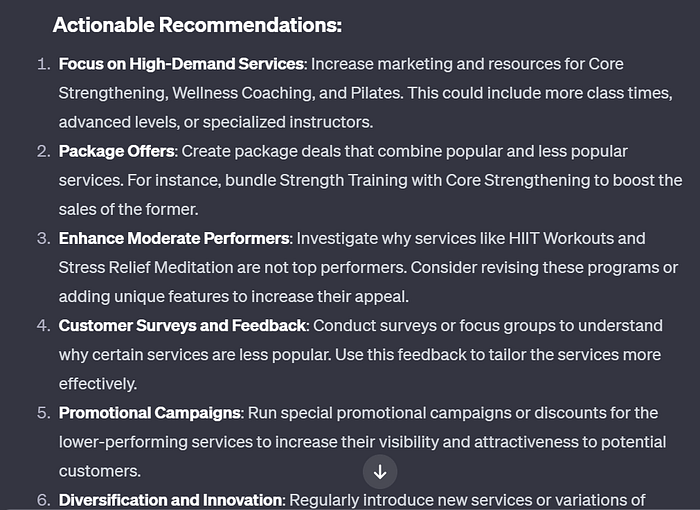
The first recommendation provided by ChatGPT is to focus on high-demand services. Since customers seem to like them, the chatbot is suggesting that James create more time-slots and different levels for these classes.
Next, it is suggesting that James create package deals to combine the top-performing services with less popular ones.
There are a few more recommendations, such as creating customer surveys, revise classes that aren't selling to well, and doing some cross-promotion.
While this advice may seem too generic for now, ChatGPT's recommendations will become more powerful when combining insights across multiple datasets.
For example, if James uploads a document containing class structures and timings, along with a customer survey dataset, ChatGPT can generate a tailored marketing strategy by segmenting his users based on availability and interest.
Here's why ChatGPT Excels at Data Analysis
The biggest strength of LLMs like ChatGPT lie in their ability to discern intricate relationships within datasets that humans might miss.
Since the GPT models have been trained on vast amounts of text data, they have seen countless examples of patterns and contexts across various topics, equipping these models to better recognize similar patterns in new datasets.
Furthermore, their technical proficiency and language capabilities enable these models to traverse large datasets and interpret the nuances of human language, effectively bridging the gap between raw data and human-readable insights.
I hope that this article helped you better understand how ChatGPT's Advanced Data Analysis plugin can be leveraged to work with data.
If you'd like to learn more about using ChatGPT for tasks related to data analysis and automation, you can read my book about ChatGPT Plus.
Note: This article contains affiliate links.