

The Motivation
As a Data Scientist, you are both the mastermind and the gatekeeper of your company's metrics. Every decision your company makes is in service of these metrics.
That is why it is vital to have the right metrics in place.
It is also why metric definition questions come up so frequently in Data Science interviews. These questions test your ability to understand the goal of a product, trace the user journey with that product and map both the goal and the journey to a set of quantifiable measures commonly known as metrics.
This is the first of two articles to help you answer metric definition questions. In this article, we will learn:
- What is a Metric
- The Three Types of Metrics
- What Makes a Good Metric
- How To Come Up with Metrics
What is a Metric?

Product metrics are quantitative data points used by companies to decide what to do, how to do it and track how well they're doing it.
- What to Do: In 2004 Lyft launched Lyft Line. What prompted their decision to expand into a carpool service? Perhaps Lyft had a metric like the total number of people transported per day. If Lyft was optimizing for this metric, then expanding into Lyft Line would be a good bet — carpooling increases the total number of people transported per ride (let alone per day). Focusing on this metric would also enable Lyfts' teams of designers, engineers, and data scientists to rally around a common goal. Metrics help companies have clarity, alignment and prioritization in what to build.
- How to Do It: Why do we spend hours on Youtube watching mind-numbing videos? Perhaps Youtube has a metric around the amount of time each user spends on the platform. If Youtube's recommendation algorithm optimizes for this metric, then it would naturally show mindless and addictive content that people would likely spend more time watching. If instead, YouTube had a metric around the amount of time each user spent watching history videos, the Youtube user experience would be a lot different from what it is today. Metrics help a company decide how to build the product once they've prioritized what to build.
- How Well They're Doing it: In 2016 Snapchat bought Bitmoji on the gamble that it would help users better express themselves on the platform. How did Snapchat determine if they made the right bet? Snapchat may have had a metric around the number of stories a user creates in a day. They may have hypothesized that if users were better able to express themselves with bitmojis, it would incentivize them to create more stories each day. The increase in the number of stories users created after bitmojis were integrated could indicate how beneficial Snapchats gamble proved to be. Metrics help a company determine how successful they are and hold them accountable to an outcome.
The Three Types of Metrics
Amazon is an online multinational marketplace made up of buyers and sellers. They most likely have large scale marketing campaigns devoted to encouraging new businesses to join their platform. Below is a hypothetical example of what the funnel for one such campaign might look like.
1. North Star
This is the single most important measure of success for a company. A North Star Metric (NSM) should be:
- a direct reflection of a company's mission
- an indicator of how a company brings value to its customers.
- the only one of its kind. Avoid having multiple NSMs as this tends to create complexity and confusion
- the answer to the following question: what is the one metric that best represents the desired outcome of your company?
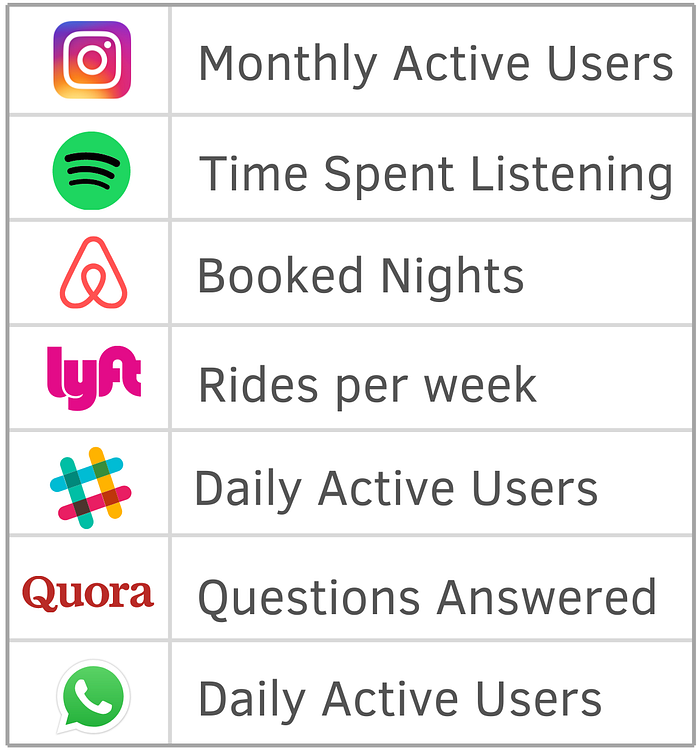
In the visual above, each step in Amazons funnel has its own metric. With so many metrics to track, how do we select a singular NSM? The answer lies in Amazon's mission: to "serve consumers through online and physical stores and focus on selection, price, and convenience." So Amazons mission is to serve its customers by fulfilling their consumer needs. One proxy for fulfillment is a the completion of a purchase. With this in mind, a good candidate for Amazons NSM could be the number of purchases per subscriber. Below are potential NSMs for a few other companies — go through the list and see if you can rationalize the metric associated with each company:
TIP: Here is a great resource for diving deeper into north star metrics from the infamous Lenny Rachitsky.
2. Primary/Goal Metric
Primary metrics depict the desired outcome of a particular product, team or initiative. This is unlike the NSM, which represents the desired outcome of the company as a whole. Consider Amazons marketing team in the example above. Their goal is to meet consumer demand by increasing the supply of high quality sellers on the platform. Given this goal, a good candidate for the marketing teams primary metric may be the number of high quality sellers that join the platform as a result of the email outreach.
The primary metric can be more valuable than the NSM in the short-term because of its narrower focus, tighter feedback loop and more immediate association with the specific product, team or initiative in question. Moreover, the primary metric ultimately feeds into the NSM.
3. Supporting/Tracking/Input Metrics
Supporting metrics are indicators that the NSM (or primary metric) is moving in the right direction. In the Amazon email marketing example, the number of emails sent, the number of people that opened the email and the number of businesses that signed up to sell on the platform are all supporting metrics. Supporting metrics serve as inputs into the NSM and are directly correlated to its value.
They are particularly useful as leading indicators to your NSM i.e. give you an idea of how your NSM will change before your NSM actually changes. In the Amazon example, a high email open rate will correlate to (and precede) a large number of high quality sellers joining the platform.
They also tell you where your efforts to move your NSM may be falling short. In the Amazon example, if you're sending 1000 emails a day, but only 10 of those emails are being opened, then the quality of your emails may need some work. Conversely, if you're sending 10 emails a day and all 10 of them are being opened, you're clearly not sending enough emails.
4. Counter Metrics/Guardrails
Counter metrics represent other outcomes that the business cares about, which may be negatively affected by a positive change in the primary metric (or NSM). They serve as guardrails. They exist to make sure that in the pursuit of your primary metric, you are not doing harm to another aspect of the business. For instance, if your primary metric focuses on product quantity, your guardrail metric might be around product quality. In the Amazon email marketing example, the guardrail in response to the primary metric might be the average number of purchases a user makes in a day. This guardrail ensures that the influx of sellers that the primary metric optimizes for doesn't result in consumers becoming so overwhelmed by choice, that they end up not buying anything at all.
What Makes A Good Metric?
Good metrics should be meaningful, measurable, and moveable.
1. Meaningful:
A metric is meaningful if it reflects the desired outcome of a product. And the desired outcome should reflect the way a company intends to drive value for its customers (based on the company's mission).
TIP: This is specific to North Star and primary metrics.
By making sure your metric is focused on an outcome, you avoid ending up with a vanity metric.
Quora uses push notifications to alert users when they would be best suited to answer a question. However, the number of times users click on the notification and open the app is a vanity metric. It may make Quora feel good to see open rates going up. But Quora didn't release push notifications to drive open rates. The outcome they were aiming for was to get high quality answers to questions asked on their platform. So an outcome oriented metric would focus on answer rates, not open rates.
By making sure your metric is focused on a desired outcome, you avoid ending up with an irrelevant metric.
Consider the Amazon example from earlier. Why did we settle on the number of high quality sellers as our primary metric? After all, the total number of new sellers that signed up on Amazon would also be an outcome. But is it the desired outcome? Remember, Amazon's mission is to "serve consumers …". Focusing on increasing the overall number of sellers has the risk of acquiring low quality sellers in the process. This would compromise the consumer experience. However, a metric around increasing the number of high quality sellers is a more relevant metric inline. It focuses on creating a better consumer experience thereby supporting the desired outcome of serving consumers.
2. Measurable:
To make sure your metric is measurable, translate it into a formula and be as precise as possible in the formulation. Each component of that formula should be a datapoint that you can collect with high confidence and precision. And remember to add a time frame to your metric.
Snapchats mission is to 'empower people to express themselves…'. But 'how well users are able to express themselves' is not a very good metric. It's hard to measure. You can try to measure it. For example you could create a survey. But you will run into two problems:
- You can't force users to complete a survey and
- How well users feel like they are able to express themselves is subjective. This results in inconsistencies in the data collected.
A better metric is: Average Number of Stories Created per User per Day = Number of Stories Created in a Day / Total Number of Active Users in a Day
TIP: Even when your time frame is a single day, as in the case of the average number of stories created per user per day, it is better to take this average across 30 days rather than a single day to smooth out volatilities.
3. Moveable:
The value of a metric should be able to change when the business takes actions to change it. It is not valuable to track a metric that is out of your control. For instance, the amount of time a person has to wait for a web page to load has proven to have significant impacts on a user's experience. If it took a whole minute for Googles' search results to load, then 'Google it' would no longer be a verb. So it is in the best interest of companies (like Pinterest) to work towards improving a web page's performance. One metric to capture these improvements might be Page Load Time. This is the time difference between a user clicking on a link or typing the URL in the browser and the page being rendered to the user. However, Page Load Time varies significantly based on a user's own internet speed and bandwidth. These are two factors that a company has no control over. Rather than measuring the end to end Page Load Time, a better metric would focus on only a portion of the Page Load time — the portion that a company can actually take steps to improve.
There are a few other things a metric should be:
- Have a Tight Feedback Loop: In addition to being movable, metrics should move quickly — actions taken to influence the metric should be (almost) immediately observable. For instance, Coursera is an online education platform with a monthly subscription service. If they release a new feature with the end goal of improving retention, they would have to wait an entire month for the next subscription cycle to see how many of their users were retained. A better option would be to find a more immediate proxy that correlates with retention. For example, Coursera may look at daily active users — if daily active usage increases, this would indicate that more people are finding value from the platform and would be less likely to churn at the end of the month. The best part is, you won't have to wait for the end of the month to see the impact of your efforts on daily active users .
- Interpretable: Metrics should be straightforward and easy to understand. The role of a metric is to align teams around a specific goal so that they can take the right steps towards achieving that goal. If people can't understand the metric, they can't take the right steps to optimize for it. For instance, YouTube might want to measure how its users engage with Youtube's videos. One metric could be the median of a weighted combination of viewing time, comments, likes, shares per user (with each action having different weights based on its importance). While this may be more accurate, it's also overly complicated. A simpler option may just be average watch time per user.
- Not Gameable: Metrics are gameable when a company can take actions to move the metric without (or at the expense of) generating real value. In 2016 Wells Fargo's earning report stated that their goal was to build long-term retail banking relationships. That same year they paid $185million to settle a lawsuit filed by LA regulators. Why? Wells Fargo had wagered that the more accounts a client has opened at their bank, the stronger and deeper the client-Wells Fargo relationship would be. Reasonable enough. Except for the fact that employees became so hyper focused on this metric that they opened 3.5 million accounts on behalf (and without the knowledge and consent) of their customers. Metrics are proxies for the value a company aims to generate. Disassociating the metric from the value leads to bad incentives and unwanted gamification.
Coming Up With Metrics
So far we've discussed why metrics matter, the different types of metrics that exist, and what makes a good metric. But how do you actually come up with metrics?
Defining your primary metric is pretty straightforward. Determine the desired outcome of the product, feature or project in question (keeping the company's mission in mind). Map this desired outcome to a metric that is meaningful, measurable and moveable.
Supporting and counter metrics are slightly trickier. There are so many to choose from and you can quickly find yourself getting lost in a wormhole of possibilities. But you may have noticed, all the metrics we've discussed so far have one thing in common. Number of emails opened, number of sign ups completed, number of questions answered, time spent on the platform. They are all representations of actions that a user can take. Therefore, the best way to come up with these metrics is by tracing a users journey with your product. Brainstorm the actions that a user may take each step of the way and translate each action into a metric.
A common approach to breaking down the user journey is the AARRR (or Pirate Metric) framework introduced by Dave McClure. It breaks down the user journey by Acquisition, Activation, Retention, Referral and Revenue. I've adjusted the framework slightly from AARRR to AAAERRR:
- Awareness: How many people are aware your brand exists?
- Acquisition: How many people are interacting with your product?
- Activation: How many people are realizing the value of your product?
- Engagement: What is the breadth and frequency of user engagement?
- Revenue: How many people are paying for your product?
- Retention/Renewal: How often are your people coming back?
- Referral: How many customers are becoming advocates?
TIP: Some phases of the funnel may not apply to your particular product of interest. That's ok. If it doesn't fit, don't force it to.
AAAERRR might seem like a lot to remember. But as we dig into it, you will see its pretty intuitive — in fact, it's a lot like falling in love!
1. Awareness:
How many people are aware your brand exists?
Dating Analogy: Before someone can fall in love with you, they need to know you exist.
People can't use your product if they don't know it exists. Everything that a company does by way of marketing is in service of increasing awareness for their product.
If your target audience walks by a sign with your logo on it, and they are able to associate that logo with your company, then they are aware. While this interaction in particular is difficult to measure, there are a few things that can be measured including:
Awareness Metrics: number of website visits, social media metrics (number of likes, shares, impressions, reach), time spent on a website, email open rate
2. Acquisition:
How many people are interacting with your product?
Dating Analogy: Once the object of your desire knows you exist, do they seem interested in getting to know more about you? Did they give you their number? Follow you on Insta?
Once your target audience knows you exist, are they taking steps to interact with your product? Did they create an account? Sign up for a mailing list? Sign up for the trial?
In marketing, the holy grail of acquisition is capturing leads. A lead is any potential user who's information you've been able to capture in some shape or form. For example, people who give you their email addresses when they sign up for your mailing list are considered to be leads. A lead becomes a qualified lead when they show additional interest in your product beyond giving you their information. For example, in addition to signing up for your mailing list they also watch a webinar or sign up for a demo.
Acquisition Metrics: number of leads, number of qualified leads, sign ups, downloads, install, chatbot interactions
3. Activation:
How many people are realizing the value of your product?
Dating Analogy: The elusive spark. Whether it happens on the first date or the fifth. It is the moment you realize how special the person you're seeing really is. The moment you realize you want more than just a fling. The moment you realize that you are ready to be exclusive.
This is also known as the 'Aha' moment. It is "a set of actions that separates customers who find value in your product from those who don't" according Benn Stancil of Mode Analytics.
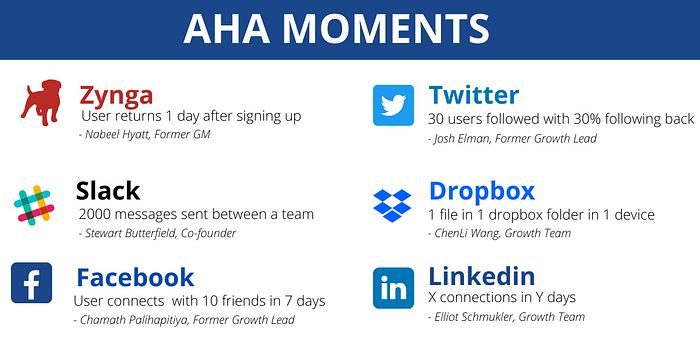
Take Dropbox. Their activation metric is the number of users that have stored at least one file in one dropbox folder on one device. This makes sense. If a user never stored a file in their Dropbox folder would they ever recognize the true value of the product? Even if they had created an account, opened the app, read through the tutorials. If they never bothered to take the most important step — how would they understand the value that Dropbox has to offer. Why would they become a user at all?
When the activation hurdle is crossed, an individual goes from unknown entity to actual user.
Activation Metrics: number of connections made, number of times an action is performed, number of steps completed
TIP: Activation metrics are a bit tricker than the rest. They depend heavily on the product in question. They are typically in the form of an action taken x times with in a period of y days.
4. Engagement:
What is the breadth and frequency of user engagement?
Dating Analogy: Now that you're seeing each other exclusively, what does your relationship look like? Are you with each other every day all day? (Might be a bit unhealthy but oh well). And what do you do in your time together? Are you watching Netflix? Cooking dinners? Going on vacations?
Now that you have a user, you need to understand what their usage looks like. This consists of two parts, the depth of their usage and the breadth of their usage.
Depth refers to usage frequency. How often are they using your product? Is it above or below the average users frequency?
Breadth refers to their diversity of use. If there are multiple actions that can be taken within your product, are they performing every action possible? Are they favoring some more than others? What if you have multiple products? Are they using all of them?
Engagement Metrics: daily, weekly and monthly active users, time spent in a session, session frequency, actions taken in the product
5. Revenue:
How many people are paying for your product?
Dating Analogy: The commitment. The magic words. The 'Will You..' and the 'I Do..'.
Users are nice but paid users are better. For some companies you can't be a user without paying first. But there are many companies that work on a freemium or trial to paid conversion model. SaaS businesses derive revenue from subscriptions, whereas marketplaces work on a commission-per-transaction basis. The way users pay you will vary by the type of business you have. It is important to understand a company's revenue model because it will influence the kind of revenue metrics they track.
But remember, a business should optimize for the value they bring to their customers, not the revenue they generate. And, if their customers are deriving a lot of value from the business, willingness to pay will be a natural byproduct.
Revenue Metrics: % of paid customers; average revenue per customer; conversion rate of trial to paid customers; number of transactions completed; shopping cart abandonment rates; ad-metrics like click-through-rate and conversion rate (crucial for ads based businesses)
6. Retention:
How many users are returning to your product?
Dating Analogy: Contrary to traditional belief, marriage is not an unbreakable bond. Divorce is always an option. An option you want to avoid at all costs.
How many of your users are coming back to your product? How often do they come back? For ecommerce platforms this could be how often users come back to make a purchase. For social media products it refers to how often users come back to the app.
The frequency with which users come back to the platform depends on the product. Turbo Tax is used once a year while Spotify is used once a day. It is vital to understand the cadence with which your product should be used. This will allow you to track the right metrics and determine if your product is sticky or if your users are churning.
Retention is not only a good gauge of how much value your products are bringing to your users but how much money you can save in marketing. The cost of acquiring a new customer can be five times more than retaining an existing one.
Retention Metrics: % of users coming back to your platform each day, month, year; churn rates; customer lifetime value
7. Referral:
How many customers are becoming advocates?
Dating Analogy: My less than exciting love life does not qualify me to speak to this.
Are your users so obsessed with your product that they want the world to know about it? Similar to retention, referrals not only an indicate how much your product is delighting your customers but also reflect how much money you are saving on marketing. Word of mouth is a powerful tool. It is the difference between a friend recommending a restaurant and you seeing an ad for it on Yelp. The power of a recommendation from a person you trust beats the intrusiveness of (often unwanted) advertisements any day.
Referral Metrics: Net Promoter Score, viral coefficient i.e. the average number of people that your users refer you to
What Next?
Data science metric definitions questions come in two forms:
- How would you define metrics for this product/feature
- How would you measure the success of this product/feature
Through this article, you should have a good grasp of the theory required to answer these questions. In the next article, we will walk through execution. I will outline a framework you can use to structure your answer as well as an example to help you implement this framework.
This is part of a greater Data Science Interview Preparation series. With each article I dive deep into interview questions around Machine Learning, Product & Business Sense, Statistics & Probability and SQL.
I will also share personal stories around my journey included how I broke into Data Science, my salary and how I manage my finances, and my favorite resources for learning and inspiration. You can stay up to date with the latest by following me on Medium.
If you would like to get in touch you can, find me on LinkedIn or Twitter or email me directly.