
Imagine this: You're launching a sleek new website design, confident it will boost conversions. But what if it doesn't? What if the old design was actually more effective?
How do you know for sure — without relying on guesswork?
This is where A/B testing comes in — the secret sauce behind data-driven decisions. It's like a scientific showdown between two versions: the old and the new. Which one wins? The data decides.
In this blog, we'll guide you step-by-step through an A/B testing process using Python. Spoiler alert: It's easier than you think!
What is A/B Testing?
A/B testing (or split testing) is a method of comparing two versions (A and B) of something to see which performs better. It's like trying two flavors of ice cream to figure out which one you like more — but with data.
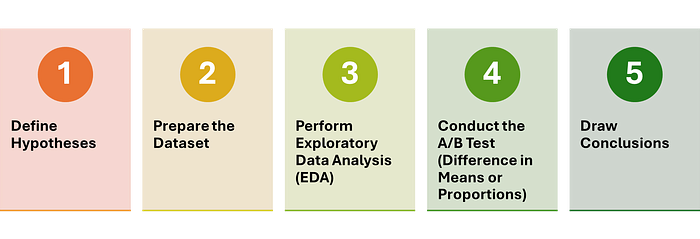
Key Steps in A/B Testing:
Scenario
Your company has launched a new website design (Version B) and wants to know if it leads to more conversions compared to the old design (Version A).
The Goal: Use A/B testing to determine if the new design improves the conversion rate.
1. Define Hypotheses
Before diving into the data, we need to set up our hypotheses.
- Null Hypothesis (H0): There is no difference in conversion rates between the old and new website designs.
- Alternative Hypothesis (H1): The new website design leads to a higher conversion rate than the old design.
2. Prepare the Dataset
For this tutorial, we'll generate a synthetic dataset to simulate website traffic and conversions.
import pandas as pd
import numpy as np

# Set random seed for reproducibility
np.random.seed(10)

# Simulate data for 10,000 users
n_users = 10000

# 50% users see old design, 50% see new design
group = np.random.choice(['A', 'B'], size=n_users)

# Simulate conversion rates (5% for old design, 6.5% for new design)
conversion_rate_A = 0.05
conversion_rate_B = 0.065

# Assign conversions
conversions = np.where(
    (group == 'A') & (np.random.rand(n_users) < conversion_rate_A), 1,
    np.where((group == 'B') & (np.random.rand(n_users) < conversion_rate_B), 1, 0)
)

# Create DataFrame
data = pd.DataFrame({'Group': group, 'Converted': conversions})

# Display first few rows
print(data.head())
Output:
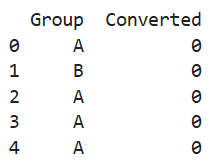
A DataFrame with columns for the group (A or B) and whether the user converted (1 for yes, 0 for no).
3. Perform Exploratory Data Analysis (EDA)
Let's get a quick overview of the data to make sure everything looks good.
# Check the distribution of groups
print(data['Group'].value_counts())

# Check conversion rates per group
conversion_rates = data.groupby('Group')['Converted'].mean()
print(conversion_rates)
Output:
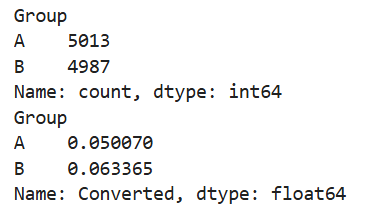
You should see around 5% conversion for Group A and around 6.3% for Group B.
4. Conduct the A/B Test
Now comes the fun part — testing whether the difference in conversion rates is statistically significant.
Since we're dealing with proportions (conversion rates), we'll use a two-proportion z-test.
Difference in Proportions Method
from statsmodels.stats.proportion import proportions_ztest

# Count conversions in each group
conversions_A = data[data['Group'] == 'A']['Converted'].sum()
conversions_B = data[data['Group'] == 'B']['Converted'].sum()

# Total users in each group
n_A = data[data['Group'] == 'A'].shape[0]
n_B = data[data['Group'] == 'B'].shape[0]

# Perform two-proportion z-test
count = np.array([conversions_A, conversions_B])
nobs = np.array([n_A, n_B])
stat, pval = proportions_ztest(count, nobs)

print(f"Z-Statistic: {stat:.4f}")
print(f"P-Value: {pval:.4f}")
Output:
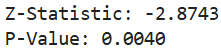
A Z-statistic and p-value. If the p-value is less than 0.05, we reject the null hypothesis.
5. Draw Conclusions
Interpreting the Results:
- If p-value < 0.05: The new website design (Version B) significantly improves conversions. Time to roll it out!
- If p-value >= 0.05: No significant difference. Stick with the old design — or consider more testing.
Conclusion:
Since the p-value is 0.004 (less than 0.05), we reject the null hypothesis and conclude that the new website design significantly improves conversions.
Final Thoughts
A/B testing is a powerful tool that helps businesses make informed, data-driven decisions. Whether you're testing a new feature, a marketing campaign, or a product design, the principles remain the same.
So, next time someone suggests a "hunch" about what works better, you'll have the tools to say, "Let's test it!"
Got questions or want to share your A/B testing experiences? Drop them in the comments!
Enjoyed this journey? Request you to please hit that clap button and share it with someone who's interested in A/B testing!
Collection of my other blogs can be found here.
You can also connect with me on LinkedIn.
Happy Learning!